

Question: The scatter plot below shows the average rent (in dollars per month) for a 1-bedroom apartment in New York City each year between 2000
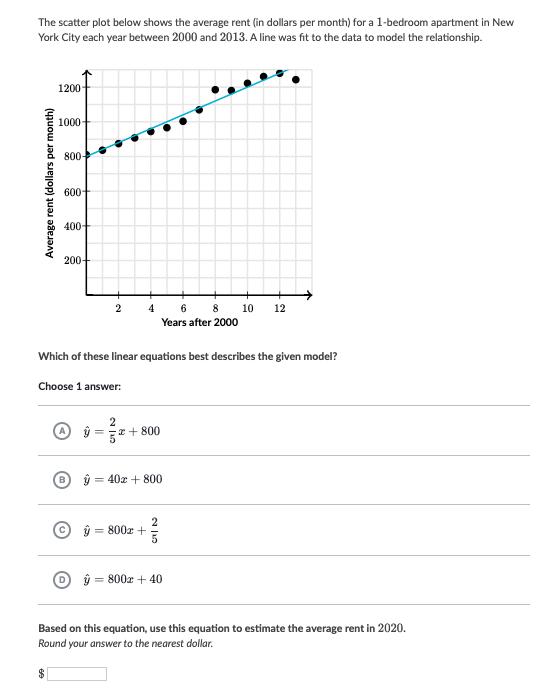
The scatter plot below shows the average rent (in dollars per month) for a 1-bedroom apartment in New York City each year between 2000 and 2013. A line was fit to the data to model the relationship. 1200 1000- 800 600- 400- 200+ 6 10 12 Years after 2000 Which of these linear equations best describes the given model? Choose 1 answer: *+ 800 %3| B. 40x + 800 %3D = 800z + = 800z + 40 Based on this equation, use this equation to estimate the average rent in 2020. Round your answer to the nearest dollar. Average rent (dollars per month)
Step by Step Solution
3.35 Rating (161 Votes )
There are 3 Steps involved in it
To solve this question follow these steps Step 1 Determine the Correct Linear Equation The options p... View full answer

Get step-by-step solutions from verified subject matter experts