

Question: The scatter plot shows the time spent texting and the time spent exercising by each of 24 students last week. Also shown is the line
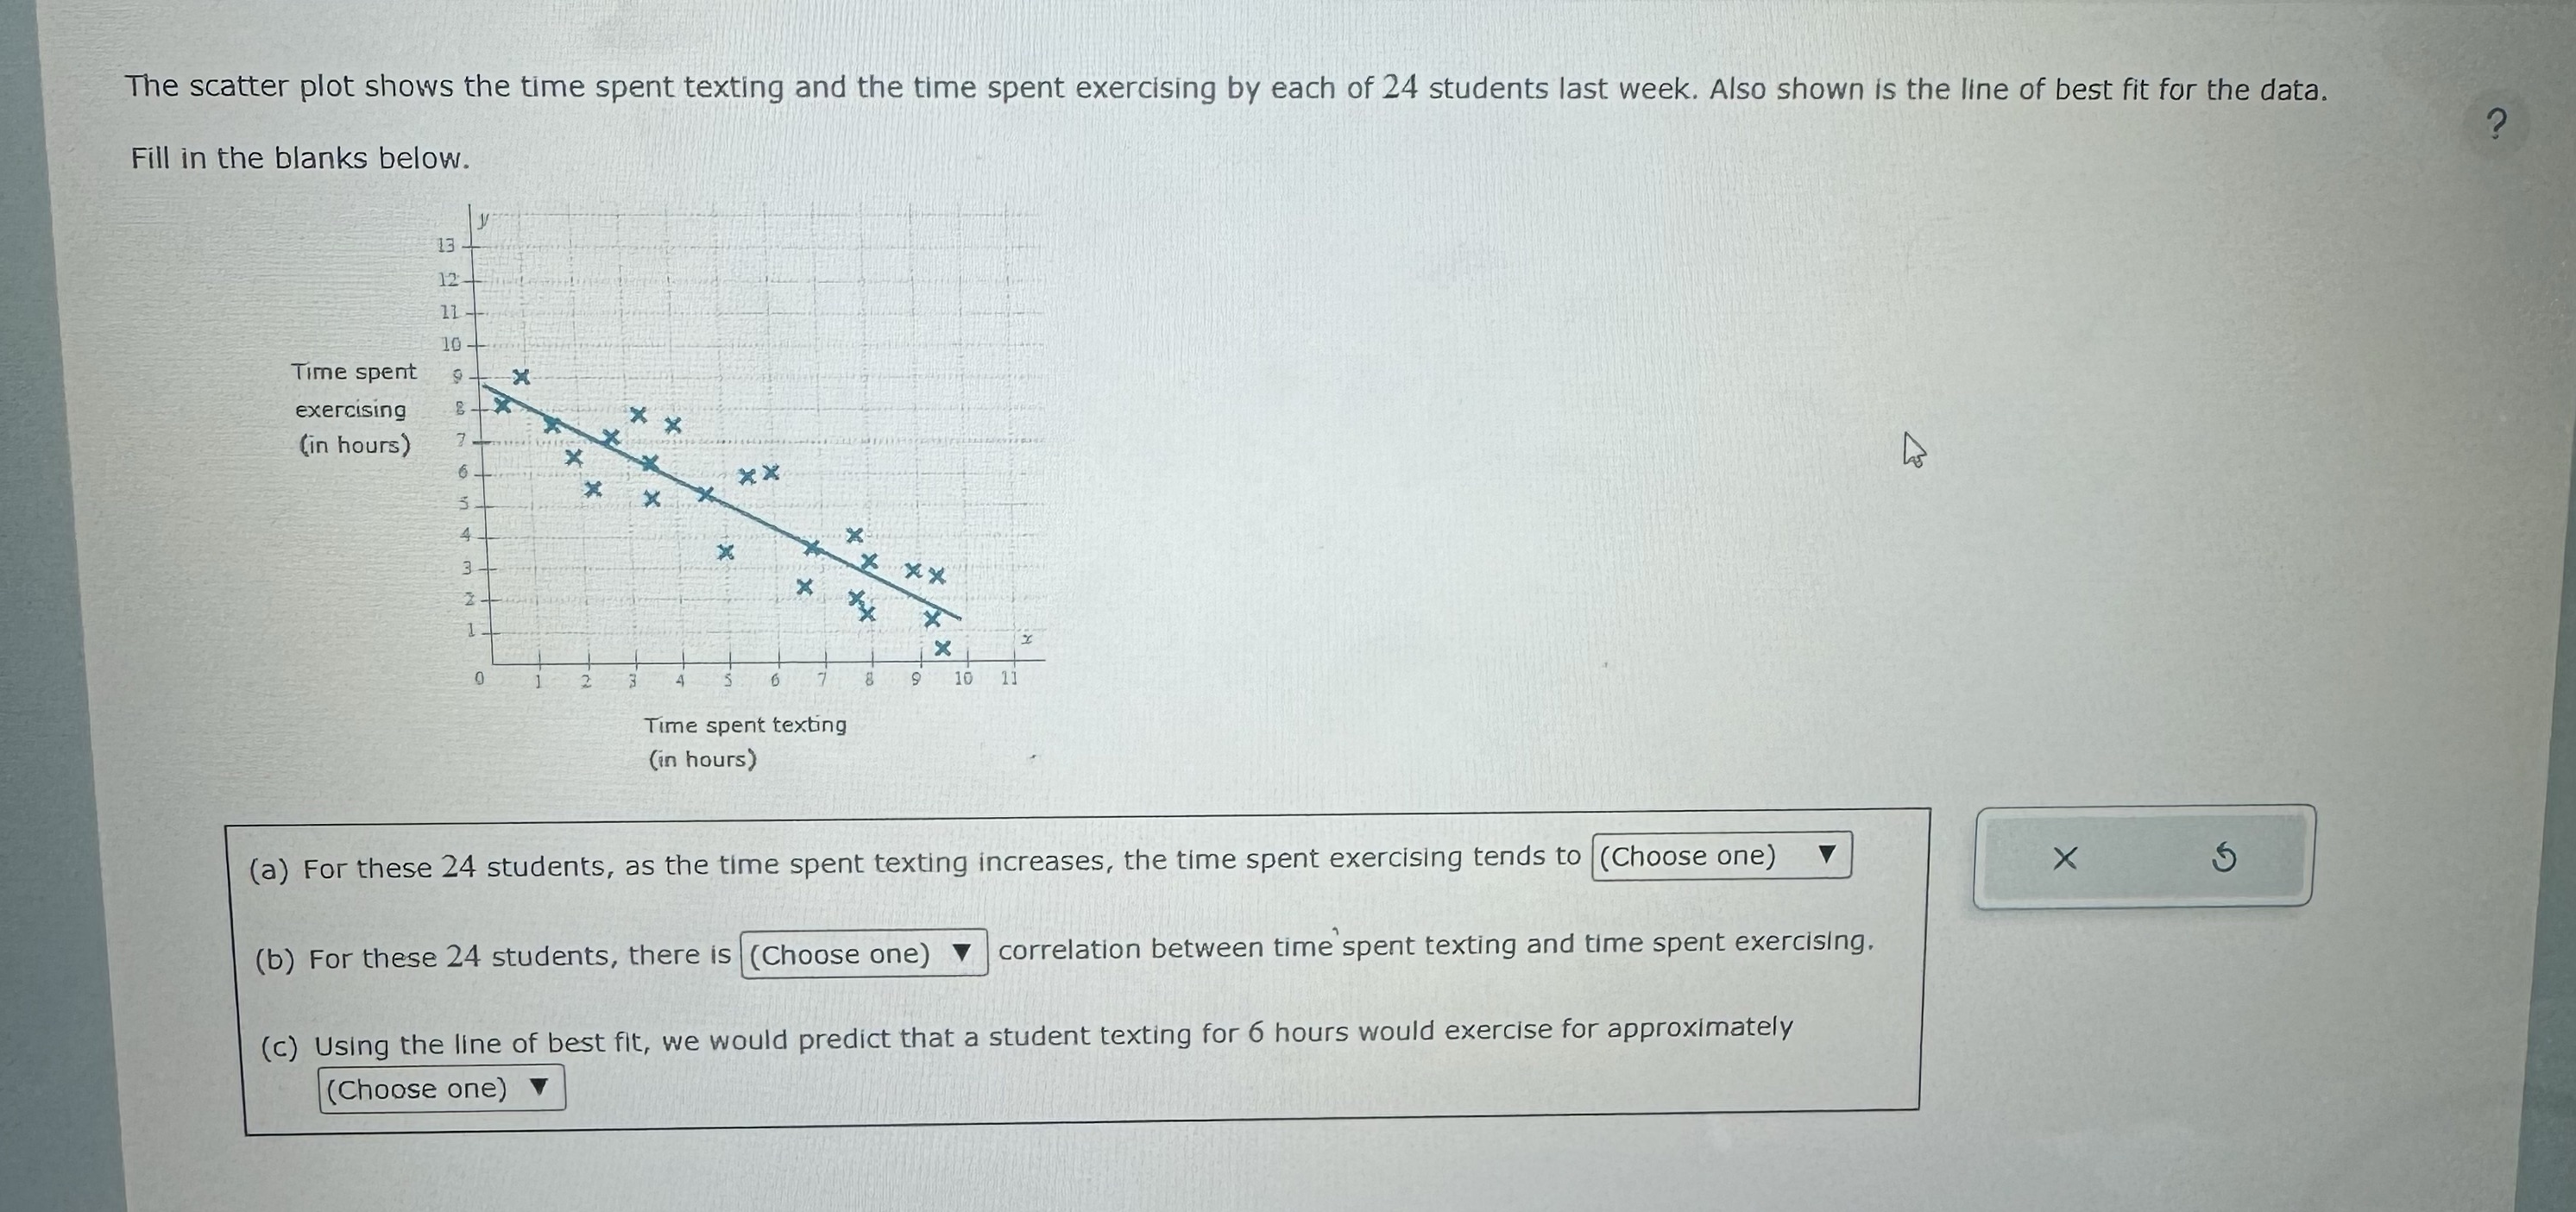
The scatter plot shows the time spent texting and the time spent exercising by each of 24 students last week. Also shown is the line of best fit for the data. 2 Fill in the blanks below. 13 12 11 10 Time spent 9 exercising X X (in hours) xX X X Xx X X 10 11 Time spent texting (in hours) (a) For these 24 students, as the time spent texting increases, the time spent exercising tends to (Choose one) X (b) For these 24 students, there is (Choose one) V correlation between time spent texting and time spent exercising. (c) Using the line of best fit, we would predict that a student texting for 6 hours would exercise for approximately (Choose one)
Step by Step Solution
There are 3 Steps involved in it

Get step-by-step solutions from verified subject matter experts