

Question: I need help with this. The question is the table and scatter plot show the time spent texting, x, and the time spent exercising, y,
I need help with this. The question is the table and scatter plot show the time spent texting, x, and the time spent exercising, y, by each of the 11 students last week. The equation of the line of best fits is y= negative 0.3x+6.79On the bottom I need help what are the answers to the predicted time spent exercising (in hours) and what is the residual (in hours).
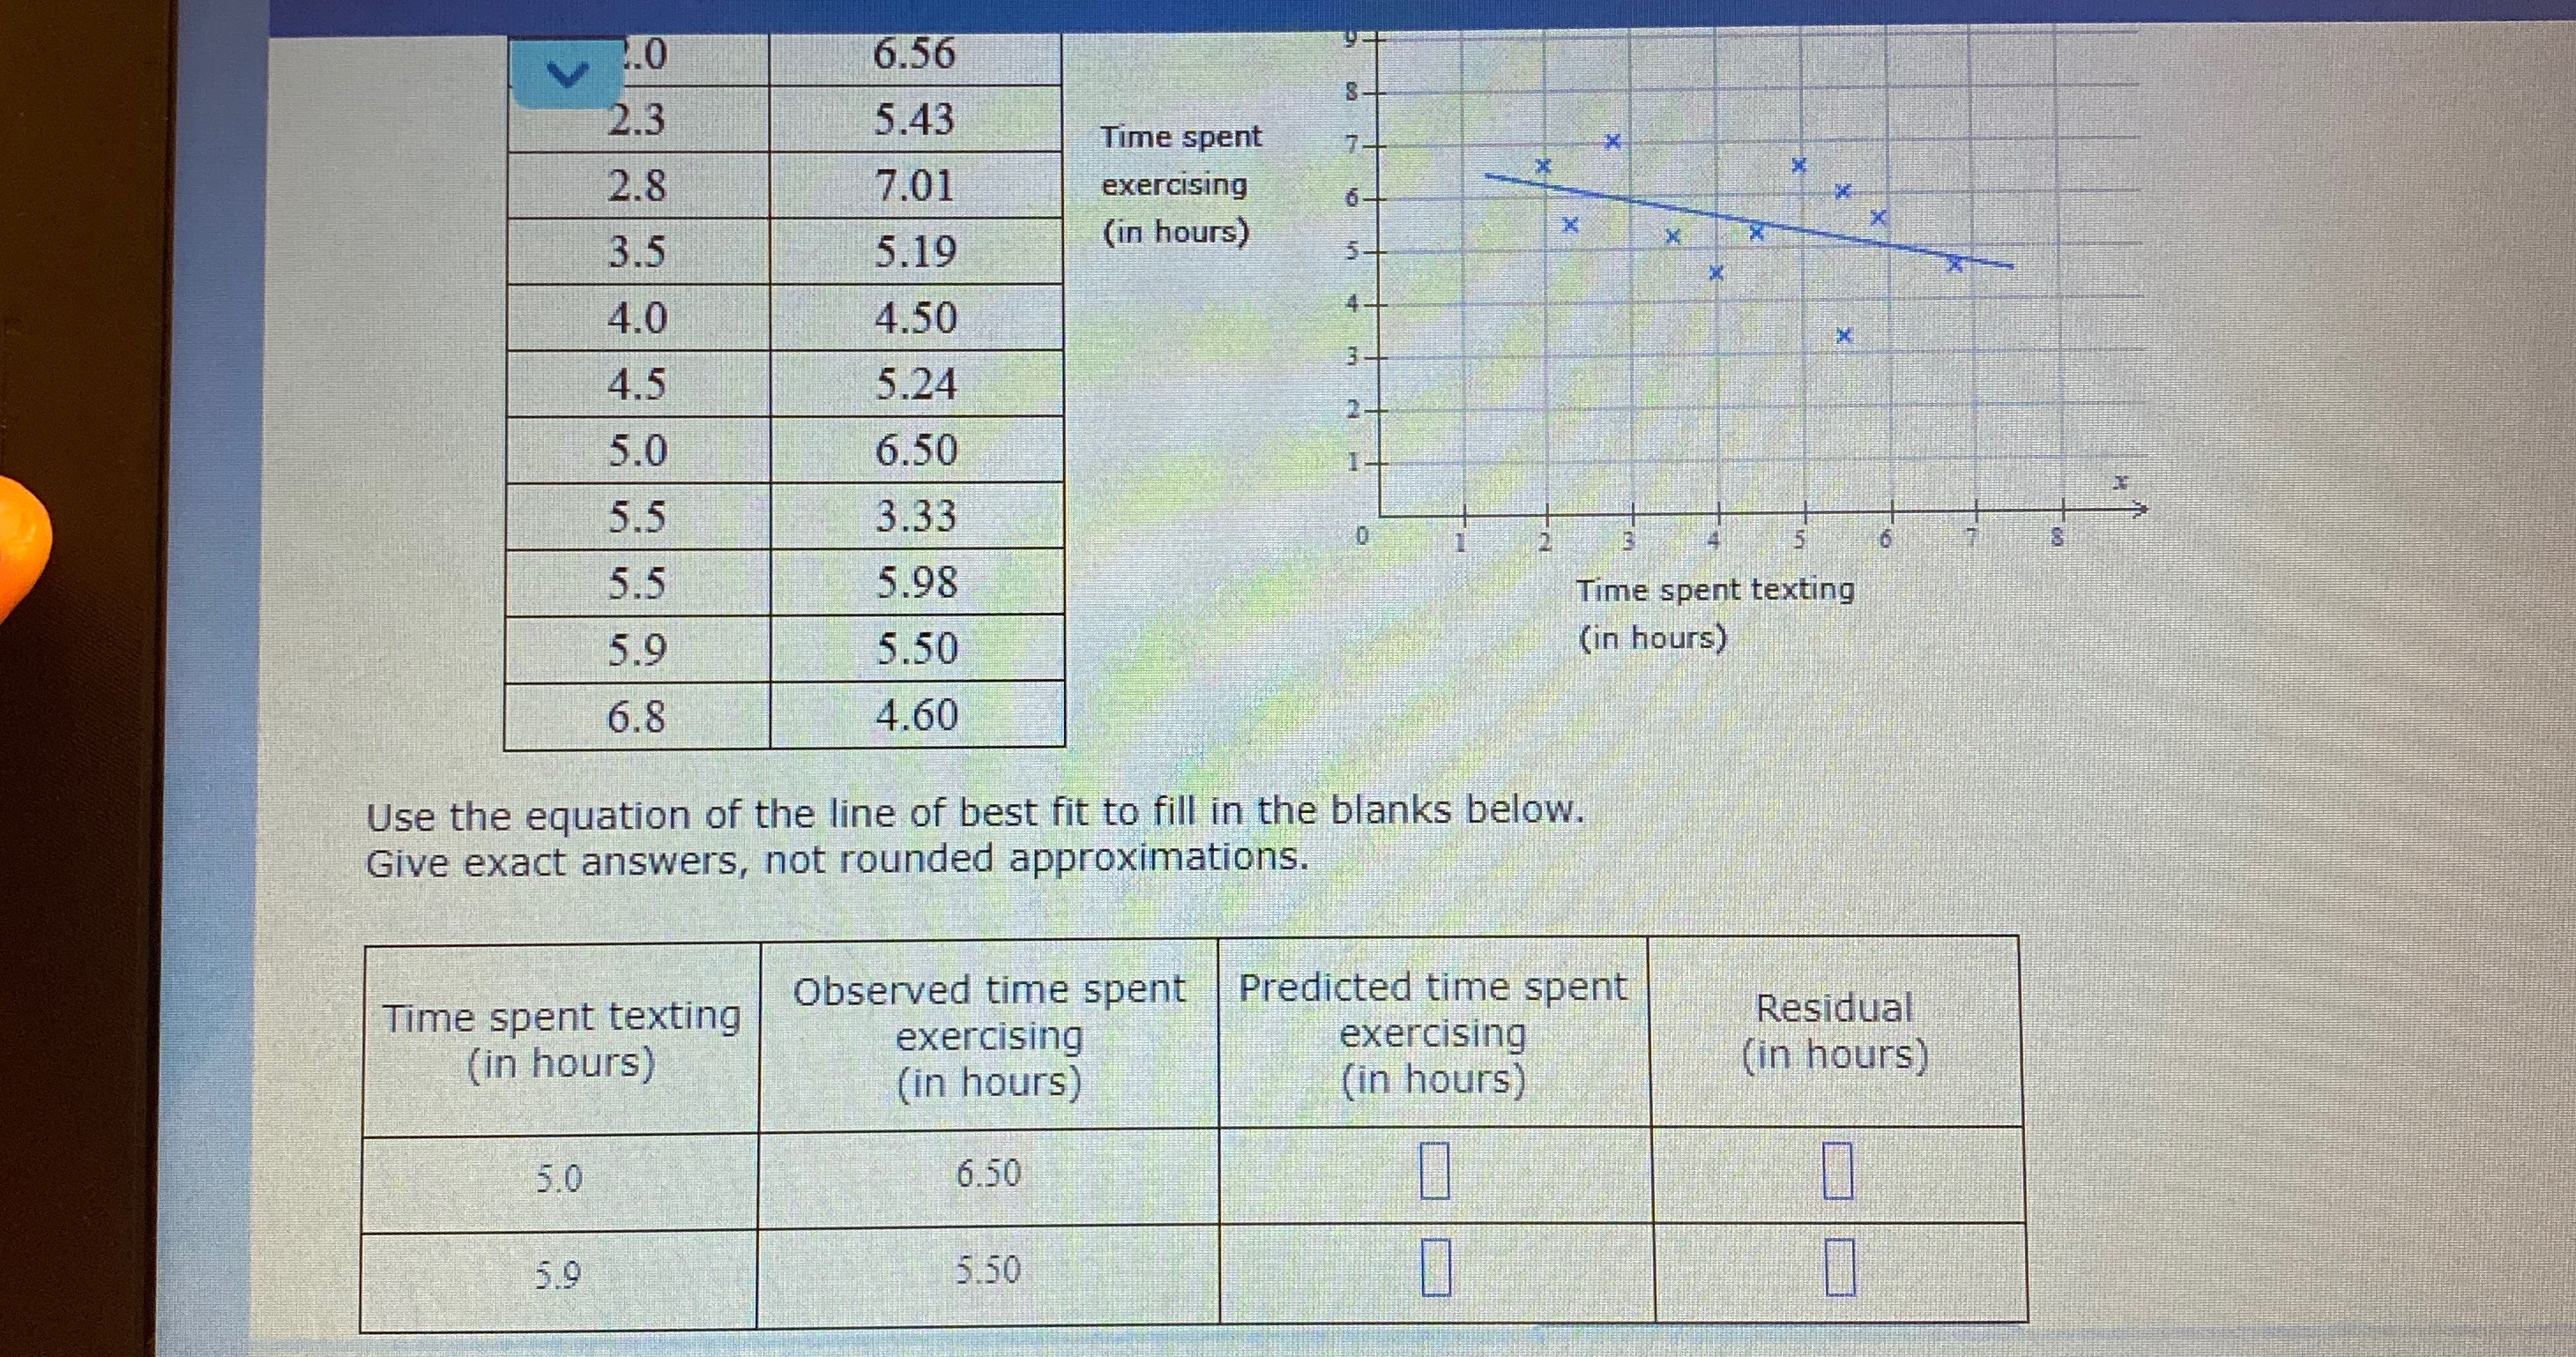
V 2.0 6.56 2.3 5.43 Time spent 2.8 7.01 exercising 3.5 5.19 (in hours) X 4.0 4.50 X 4.5 5.24 5.0 6.50 5.5 3.33 5.5 5.98 Time spent texting 5.9 5.50 (in hours) 6.8 4.60 Use the equation of the line of best fit to fill in the blanks below. Give exact answers, not rounded approximations. Time spent texting Observed time spent Predicted time spent (in hours) exercising exercising Residual (in hours) (in hours) (in hours) 5.0 6.50 5.9 5.50
Step by Step Solution
There are 3 Steps involved in it

Get step-by-step solutions from verified subject matter experts