

Question: The scatter plot shows the time spent watching TV and the time spent doing homework by each of 21 students last week. D Also shown
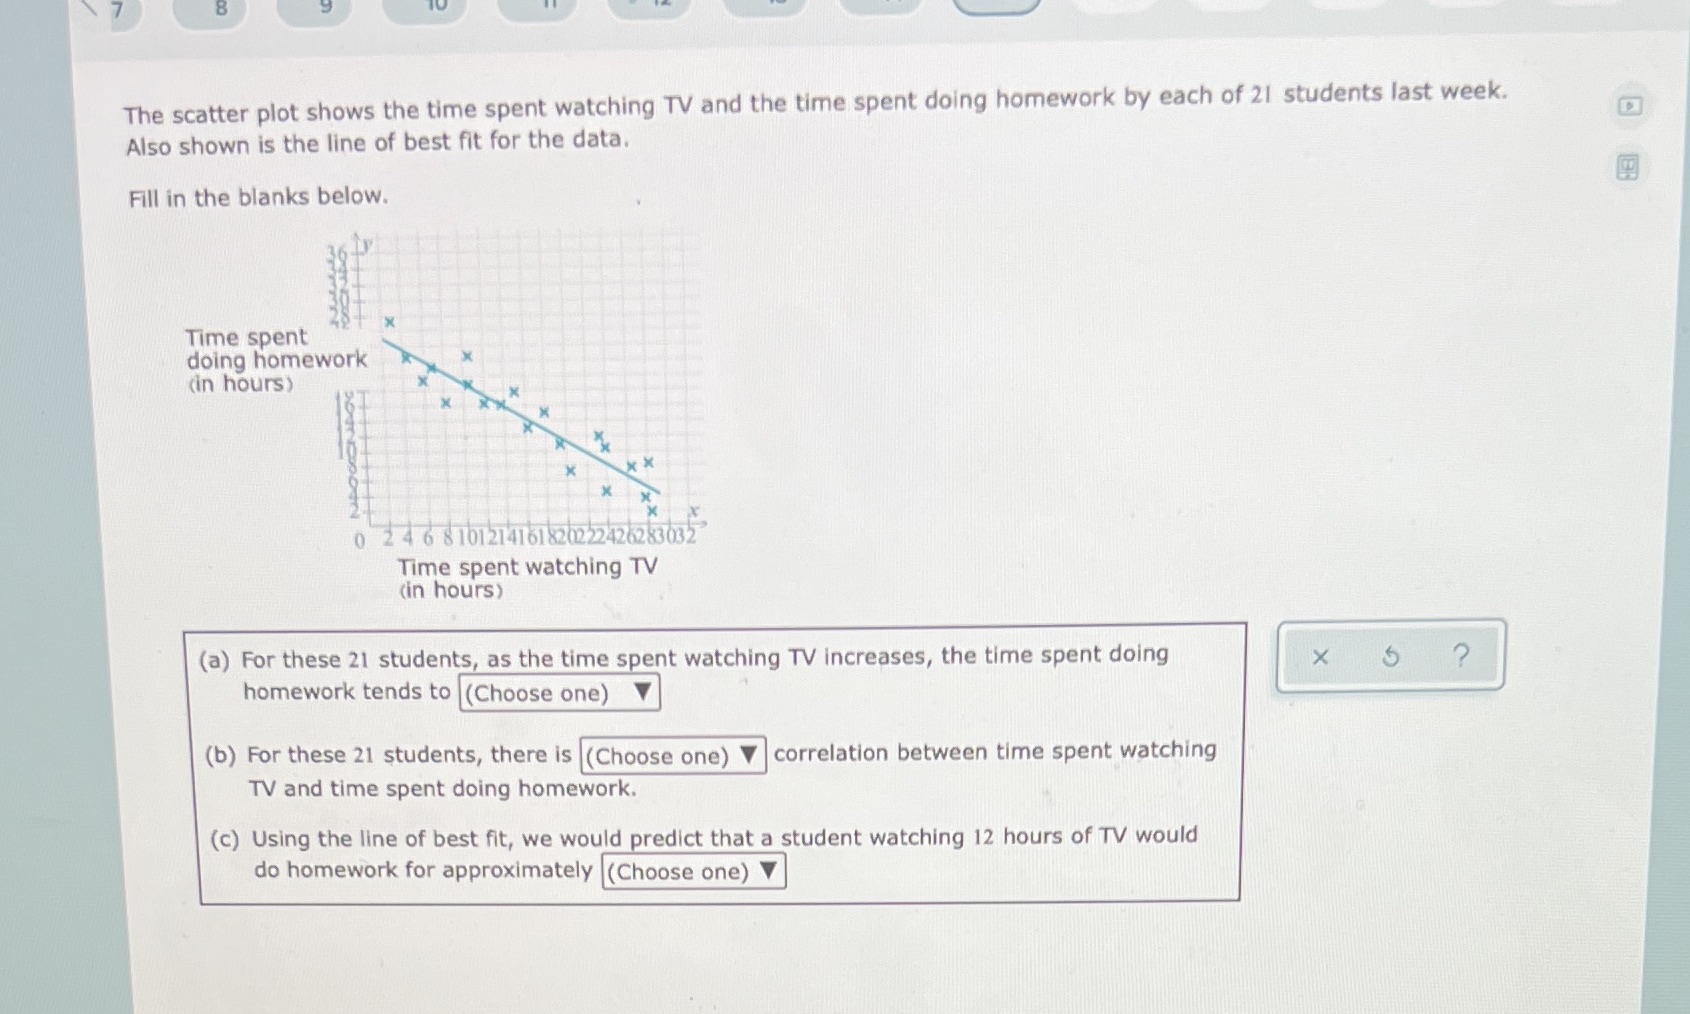
The scatter plot shows the time spent watching TV and the time spent doing homework by each of 21 students last week. D Also shown is the line of best fit for the data. Fill in the blanks below. Time spent doing homework (in hours) 0 2 4 6 8 101214161 8202524262 83032 Time spent watching TV (in hours) (a) For these 21 students, as the time spent watching TV increases, the time spent doing ? homework tends to (Choose one) V (b) For these 21 students, there is (Choose one) V|correlation between time spent watching TV and time spent doing homework. (c) Using the line of best fit, we would predict that a student watching 12 hours of TV would do homework for approximately (Choose one) V
Step by Step Solution
There are 3 Steps involved in it

Get step-by-step solutions from verified subject matter experts