

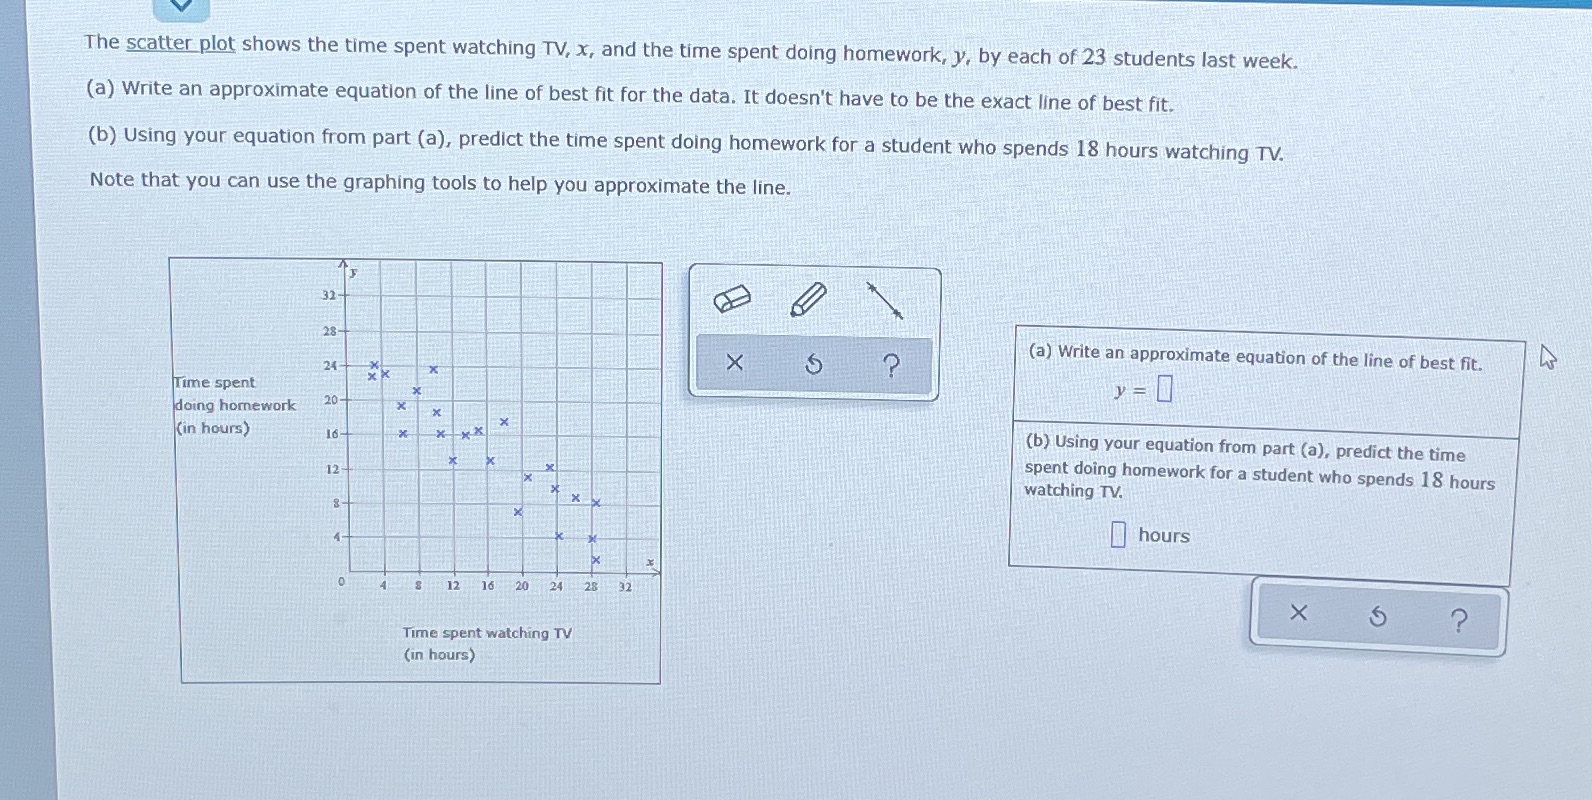
Question: The scatter plot shows the time spent watching TV, x, and the time spent doing homework, y, by each of 23 students last week. (a)
Step by Step Solution
There are 3 Steps involved in it
1 Expert Approved Answer
Step: 1 Unlock

Question Has Been Solved by an Expert!
Get step-by-step solutions from verified subject matter experts
Step: 2 Unlock
Step: 3 Unlock