

Question: The scatter plot shows the time spent watching TV, x, and the time spent doing homework, y, by each of the 23 students last week.
The scatter plot shows the time spent watching TV, x, and the time spent doing homework, y, by each of the 23 students last week. 1) what is an approximation equation of the line of best fit for the data. It doesn't have to be the exact line of best fit. 2) Using your equation from part (1), predict the time spent doing homework for a student who spends 12 hours watching TV.
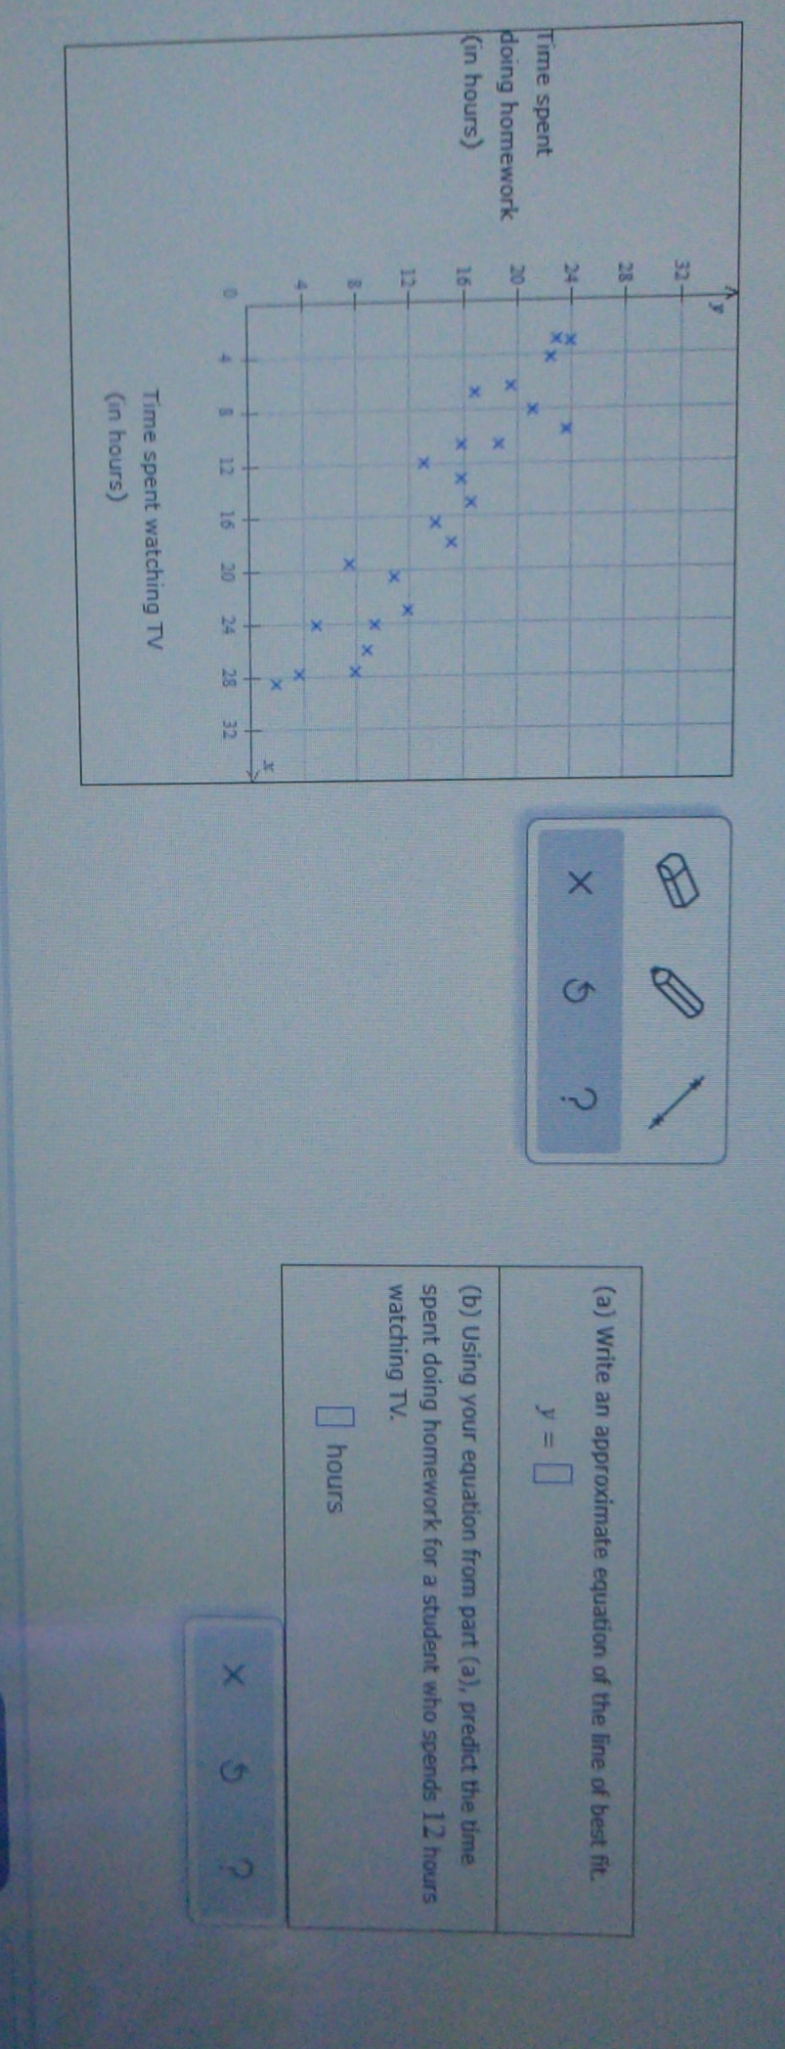
Time spent XX X (a) Write an approximate equation of the line of best fit. X doing homework K y = [ (in hours) X X (b) Using your equation from part (a), predict the time X spent doing homework for a student who spends 12 hours X watching TV. X hours 12 16 20 24 X Time spent watching TV (in hours)
Step by Step Solution
There are 3 Steps involved in it

Get step-by-step solutions from verified subject matter experts