

Question: The scatterplot to the right and the data table belowshow, for 2008cars, the carbon footprint(tons of CO2 peryear) vs. highway mileage for 20 family sedans.
The scatterplot to the right and the data table belowshow, for 2008cars, the carbon footprint(tons of CO2 peryear) vs. highway mileage for 20 family sedans.
a) The correlation is 0.730. Describe the association.
b) Are the assumptions and conditions met for finding acorrelation?
c) Usingtechnology, find the correlation of the data when the car with the lowest carbon footprint and highest highway mpg is not included with the others. Explain why it changes in that way.
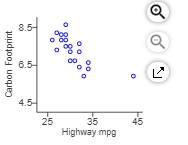
8.5- Carbon Footprint 6.5 4.5 25 35 45 Highway mpg
Step by Step Solution
There are 3 Steps involved in it
1 Expert Approved Answer
Step: 1 Unlock

Question Has Been Solved by an Expert!
Get step-by-step solutions from verified subject matter experts
Step: 2 Unlock
Step: 3 Unlock