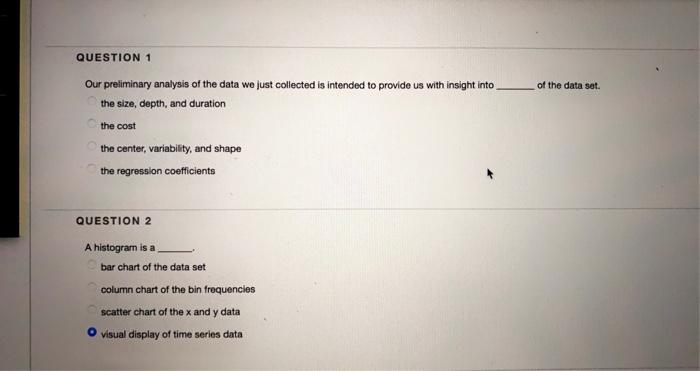
Question: The second question is not solved. Please ignore the marked answer. Thanks. QUESTION 1 of the data set. Our preliminary analysis of the data we

The second question is not solved. Please ignore the marked answer. Thanks.
The second question is not solved. Please ignore
QUESTION 1 of the data set. Our preliminary analysis of the data we just collected is intended to provide us with insight into the size, depth, and duration the cost the center, variability, and shape the regression coefficients QUESTION 2 A histogram is a bar chart of the data set column chart of the bin frequencies scatter chart of the x and y data visual display of time series data the data will appear in the histogram. QUESTION 3 The wider the bins used in the frequency distribution, the smoother larger smaller more variable QUESTION 4 The cumulative frequencies are the bin frequency as a percentage of the sample size a running total of the bin frequencies as a percentage of the sample size the total observations as a percentage of the population the number of times a specific value is observed within a bin QUESTION 5 If the data are skewed left. most of the data values are concentrated on the low side of the distribution the data have an extremely high amount of dispersion from the mean the mean is dragged to the left of the peak within the distribution the left and right tails of the distribution are approximately the same QUESTION 6 Kurtosis refers to too much sulfur, which leads to bad smelling breath the amplitude of the distribution peak the relationship betweon the x and y variables causation QUESTION 7 A histogram may reveal that a distribution has more than one mode, which might mean that the sample contains data from more than one population the data are platkurtic the sample is too small the mean is to the right of the peak on the right side of the distribution QUESTIONS A zero origin is unnecessary required to avoid deception in a column chart required to properly design a ple chart an optional design feature of a bar chart QUESTION 9 The aspect ratio is a potential source of deception if it is not approximately 1.67 the bin frequency divided by the sample size the skewness divided by the kurtosis the center divided by the variability QUESTION 10 When evaluating a scatter chart, a dot pattern that has a positive slope indicates that the predictor variable is causing the response variable to increase that the predictor and response variables have a direct correlation that the independent variable is independent of the response variable that the correlation is inverse

Step by Step Solution

There are 3 Steps involved in it

1 Expert Approved Answer
Step: 1 Unlock blur-text-image
Question Has Been Solved by an Expert!

Get step-by-step solutions from verified subject matter experts

Step: 2 Unlock
Step: 3 Unlock

Students Have Also Explored These Related General Management Questions!