

Question: The second step in Best Homes forecasting process is to collect sales projections from each of its regions. What types of data should they collect
The second step in Best Homes forecasting process is to collect sales projections from each of its regions. What types of data should they collect from the sales force? How should they integrate sales data with your answer in question 2?
I need to know this question. I already have the classical decomposition method to forecast averages
Thank you
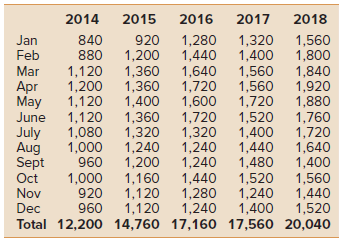
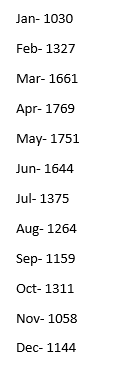
\begin{tabular}{lrrrrr} \hline & 2014 & 2015 & 2016 & 2017 & 2018 \\ Jan & 840 & 920 & 1,280 & 1,320 & 1,560 \\ Feb & 880 & 1,200 & 1,440 & 1,400 & 1,800 \\ Mar & 1,120 & 1,360 & 1,640 & 1,560 & 1,840 \\ Apr & 1,200 & 1,360 & 1,720 & 1,560 & 1,920 \\ May & 1,120 & 1,400 & 1,600 & 1,720 & 1,880 \\ June & 1,120 & 1,360 & 1,720 & 1,520 & 1,760 \\ July & 1,080 & 1,320 & 1,320 & 1,400 & 1,720 \\ Aug & 1,000 & 1,240 & 1,240 & 1,440 & 1,640 \\ Sept & 960 & 1,200 & 1,240 & 1,480 & 1,400 \\ Oct & 1,000 & 1,160 & 1,440 & 1,520 & 1,560 \\ Nov & 920 & 1,120 & 1,280 & 1,240 & 1,440 \\ Dec & 960 & 1,120 & 1,240 & 1,400 & 1,520 \\ Total & 12,200 & 14,760 & 17,160 & 17,560 & 20,040 \\ \hline \end{tabular} Jan- 1030 Feb- 1327 Mar- 1661 Apr- 1769 May- 1751 Jun- 1644 Jul- 1375 Aug- 1264 Sep- 1159 Oct- 1311 Nov- 1058 Dec- 1144Step by Step Solution
There are 3 Steps involved in it
1 Expert Approved Answer
Step: 1 Unlock

Question Has Been Solved by an Expert!
Get step-by-step solutions from verified subject matter experts
Step: 2 Unlock
Step: 3 Unlock