

Question: The second step in Best Homes forecasting process is to collect sales projections from each of its regions. What types of data should they collect
The second step in Best Homes forecasting process is to collect sales projections from each of its regions. What types of data should they collect from the sales force? How should they integrate sales data with your answer in question 2?
I dont know what to put for this answer thank you.
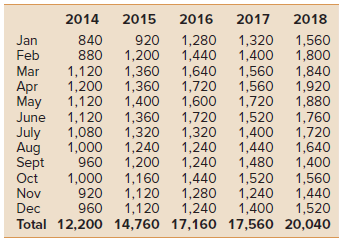
\begin{tabular}{lrrrrr} \hline & 2014 & 2015 & 2016 & 2017 & 2018 \\ Jan & 840 & 920 & 1,280 & 1,320 & 1,560 \\ Feb & 880 & 1,200 & 1,440 & 1,400 & 1,800 \\ Mar & 1,120 & 1,360 & 1,640 & 1,560 & 1,840 \\ Apr & 1,200 & 1,360 & 1,720 & 1,560 & 1,920 \\ May & 1,120 & 1,400 & 1,600 & 1,720 & 1,880 \\ June & 1,120 & 1,360 & 1,720 & 1,520 & 1,760 \\ July & 1,080 & 1,320 & 1,320 & 1,400 & 1,720 \\ Aug & 1,000 & 1,240 & 1,240 & 1,440 & 1,640 \\ Sept & 960 & 1,200 & 1,240 & 1,480 & 1,400 \\ Oct & 1,000 & 1,160 & 1,440 & 1,520 & 1,560 \\ Nov & 920 & 1,120 & 1,280 & 1,240 & 1,440 \\ Dec & 960 & 1,120 & 1,240 & 1,400 & 1,520 \\ Total & 12,200 & 14,760 & 17,160 & 17,560 & 20,040 \\ \hline \end{tabular}Step by Step Solution
There are 3 Steps involved in it
1 Expert Approved Answer
Step: 1 Unlock

Question Has Been Solved by an Expert!
Get step-by-step solutions from verified subject matter experts
Step: 2 Unlock
Step: 3 Unlock