

Question: The shape in the histogram below is best described as 20 15 Frequency 10 5 1 2 3 4 5 6 7 Were you dose

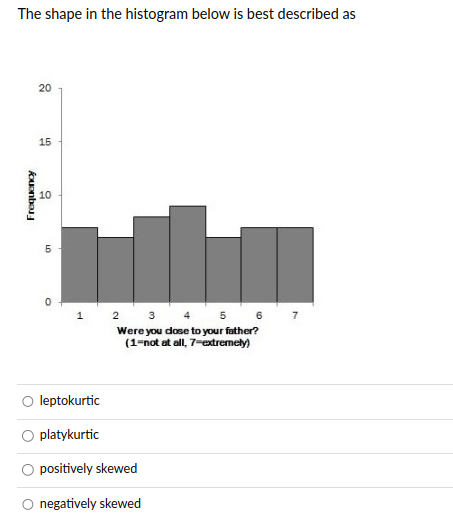
The shape in the histogram below is best described as 20 15 Frequency 10 5 1 2 3 4 5 6 7 Were you dose to your father? (1=not at all, 7-extremely) O leptokurtic O platykurtic O positively skewed O negatively skewed
Step by Step Solution
There are 3 Steps involved in it
1 Expert Approved Answer
Step: 1 Unlock

Question Has Been Solved by an Expert!
Get step-by-step solutions from verified subject matter experts
Step: 2 Unlock
Step: 3 Unlock