

Question: The single-index model (SIM) is possibly the simplest asset pricing model that we use in finance to measure the tradeoff between the systematic risk and
The single-index model (SIM) is possibly the simplest asset pricing model that we use in finance to measure the tradeoff between the systematic risk and return
of a stock. Mathematically the SIM could be expressed as rit − rf = αi + βi(rmt − rf ) + εit, (1) where rit is the (simple) return for security i at time t, rmt is the market return at
time t, rf is the risk-free rate, and εit is the error term. The coefficient βi measures the systematic risk that firm i is facing.
(b) Explain the estimated βi in words.
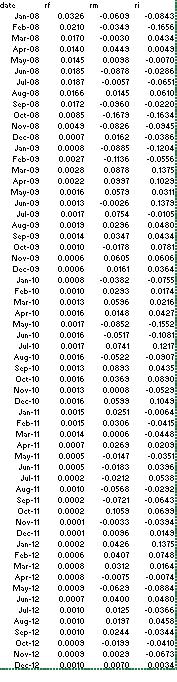
-date rf rm Jan-08 0.0326 -0.0609 Feb-08 0.0210 -0.0349 Mar-08 0.0170 -0.0030 Apr-08 0.0140 0.0449 May-08 0.0145 0.0098 Jun-08 0.0185 -0.0878 Jul-08 0.0187 Aug-08 0.0166 Sep-08 0.0172 -0.0960 Oct-08 0.0085 -0.1679 Nov-08 0.0049 -0.0826 Dec-08 0.0007 0.0162 Jan-09 0.0008 -0.0885 Feb-09 0.0027 -0.1136 Mar-09 0.0028 0.0878 Apr-09 0.0022 0.0997 May-09 0.0016 0.0579 Jun-09 0.0013 -0.0026 Jul-09 0.0017 0.0754 Aug-09 0.0019 0.0296 Sep-03 0.0014 0.0347 Oct-09 0.0010 Nov-10 0.0013 Dec-10 0.0016 Jan-11 0.0015 Feb-11 0.0015 Mar-11 -0.0057 0.0145 -0.0178 Nov-09 0.0006 0.0605 Dec-09 0.0006 0.0161 Jan-10 0.0008 -0.0382 Feb-10 0.0010 0.0293 Mar-10 0.0013 0.0596 Apr-10 0.0016 0.0148 May-10 0.0017 -0.0852 Jun-10 0.0016 -0.0517 Jul-10 0.0017 0.0741 Aug-10 0.0016 -0.0522 Sep-10 0.0013 0.0893 Oct-10 0.0016 0.0369 0.0008 0.0599 0.0251 0.0306 0.0014 0.0006 Apr-11 0.0007 0.0269 May-11 0.0005 -0.0147 Jun-11 0.0005 -0.0183 Jul-11 0.0002 -0.0212 ri -0.0843) -0.1656 0.0434 0.0049 -0.0070 -0.0286 -0.0651 0.0610 -0.0220 -0.1634 -0.0945 -0.0386 -0.1204 -0.0556 0.1375 0.1029 0.0311 0.1379 -0.0105 0.0480 0.0434 0.0781 0.0606 0.0364 -0.0755 0.0174 0.0216 0.0427 -0.1552 -0.1081 0.1217 -0.0907 0.0435 0.0890 -0.0529 0.1049 -0.0064 -0.0415 -0.04485 0.0209 -0.0351 0.0396 0.0538 -0.0292 -0.0643 0.0699 -0.03943 0.0149 0.1375 0.0748 0.0164 Aug-11 0.0010 -0.0568 Sep-11 0.0002 -0.0721 Oct-11 0.0002 0.1059 Nov-11 0.0001 -0.0033 Dec-11 0.0001 0.0096 Jan-12 0.0002 0.0426 Feb-12 0.0006 0.0407 Mar-12 0.0008 0.0312 Apr-12 0.0008 -0.0075 May-12 0.0009 -0.0629 Jun-12 0.0007 0.0400 0.0480 Jul-12 0.0010 0.0125 -0.0366 0.0197 0.0458 -0.0344) Aug-12 0.0010 Sep-12 0.0010 0.0244 Oct-12 0.0009 -0.0199 Nov-12 0.0009 0.0029 -0.0673 Rss:120.00.10 0.0070 0.0034 -0.0074 -0.0884
Step by Step Solution
3.48 Rating (161 Votes )
There are 3 Steps involved in it
Id be glad to help you with the singleindex model analysis and interpretation of the estimated betas SingleIndex Model Analysis The provided data can ... View full answer

Get step-by-step solutions from verified subject matter experts