

Question: The spectroscopic data in the table is generated with five solutions of known concentration. Use a spreadsheet program, such as Microsoft Excel, to graph the
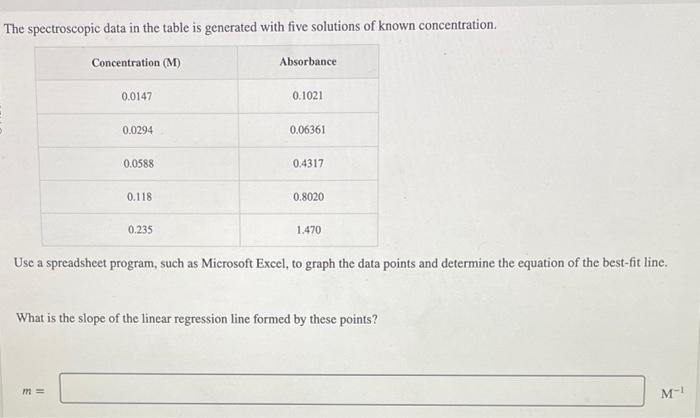
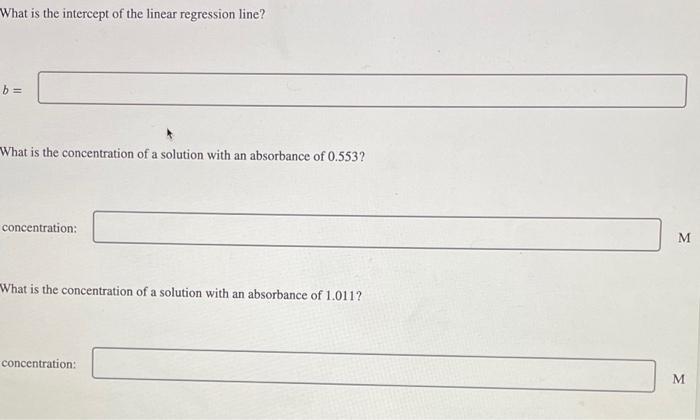
The spectroscopic data in the table is generated with five solutions of known concentration. Use a spreadsheet program, such as Microsoft Excel, to graph the data points and determine the equation of the best-fit line. What is the slope of the linear regression line formed by these points? m What is the intercept of the linear regression line? b= What is the concentration of a solution with an absorbance of 0.553 ? concentrati What is the concentration of a solution with an absorbance of 1.011 ? The spectroscopic data in the table is generated with five solutions of known concentration. Use a spreadsheet program, such as Microsoft Excel, to graph the data points and determine the equation of the best-fit line. What is the slope of the linear regression line formed by these points? m What is the intercept of the linear regression line? b= What is the concentration of a solution with an absorbance of 0.553 ? concentrati What is the concentration of a solution with an absorbance of 1.011
Step by Step Solution
There are 3 Steps involved in it

Get step-by-step solutions from verified subject matter experts