

Question: The students in a science class took a final exam. The box-and-whisker plot (sometimes called a boxplot) summarizes the exam scores. 50 55 60
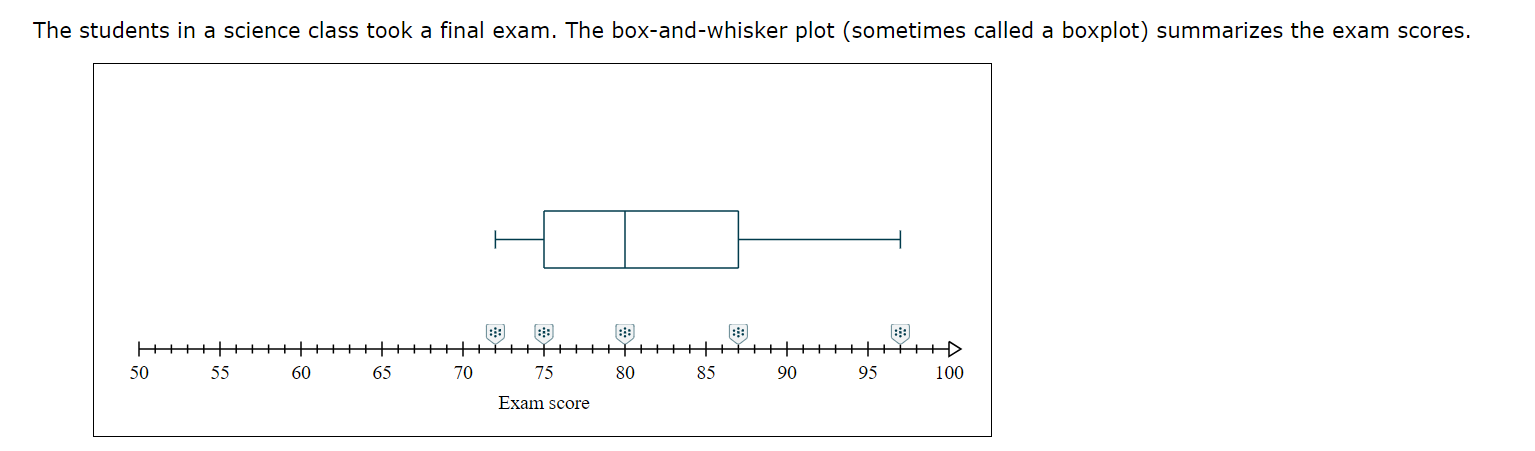
The students in a science class took a final exam. The box-and-whisker plot (sometimes called a boxplot) summarizes the exam scores. 50 55 60 65 70 75 80 85 90 95 100 Exam score
Step by Step Solution
There are 3 Steps involved in it
1 Expert Approved Answer
Step: 1 Unlock

Question Has Been Solved by an Expert!
Get step-by-step solutions from verified subject matter experts
Step: 2 Unlock
Step: 3 Unlock