

Question: Descriptive. Line below is: 55, 60, 65, 70, 75, 80, 85, 90, 95. Score on history test. The foll V data are the scores of
Descriptive. Line below is: 55, 60, 65, 70, 75, 80, 85, 90, 95. Score on history test.
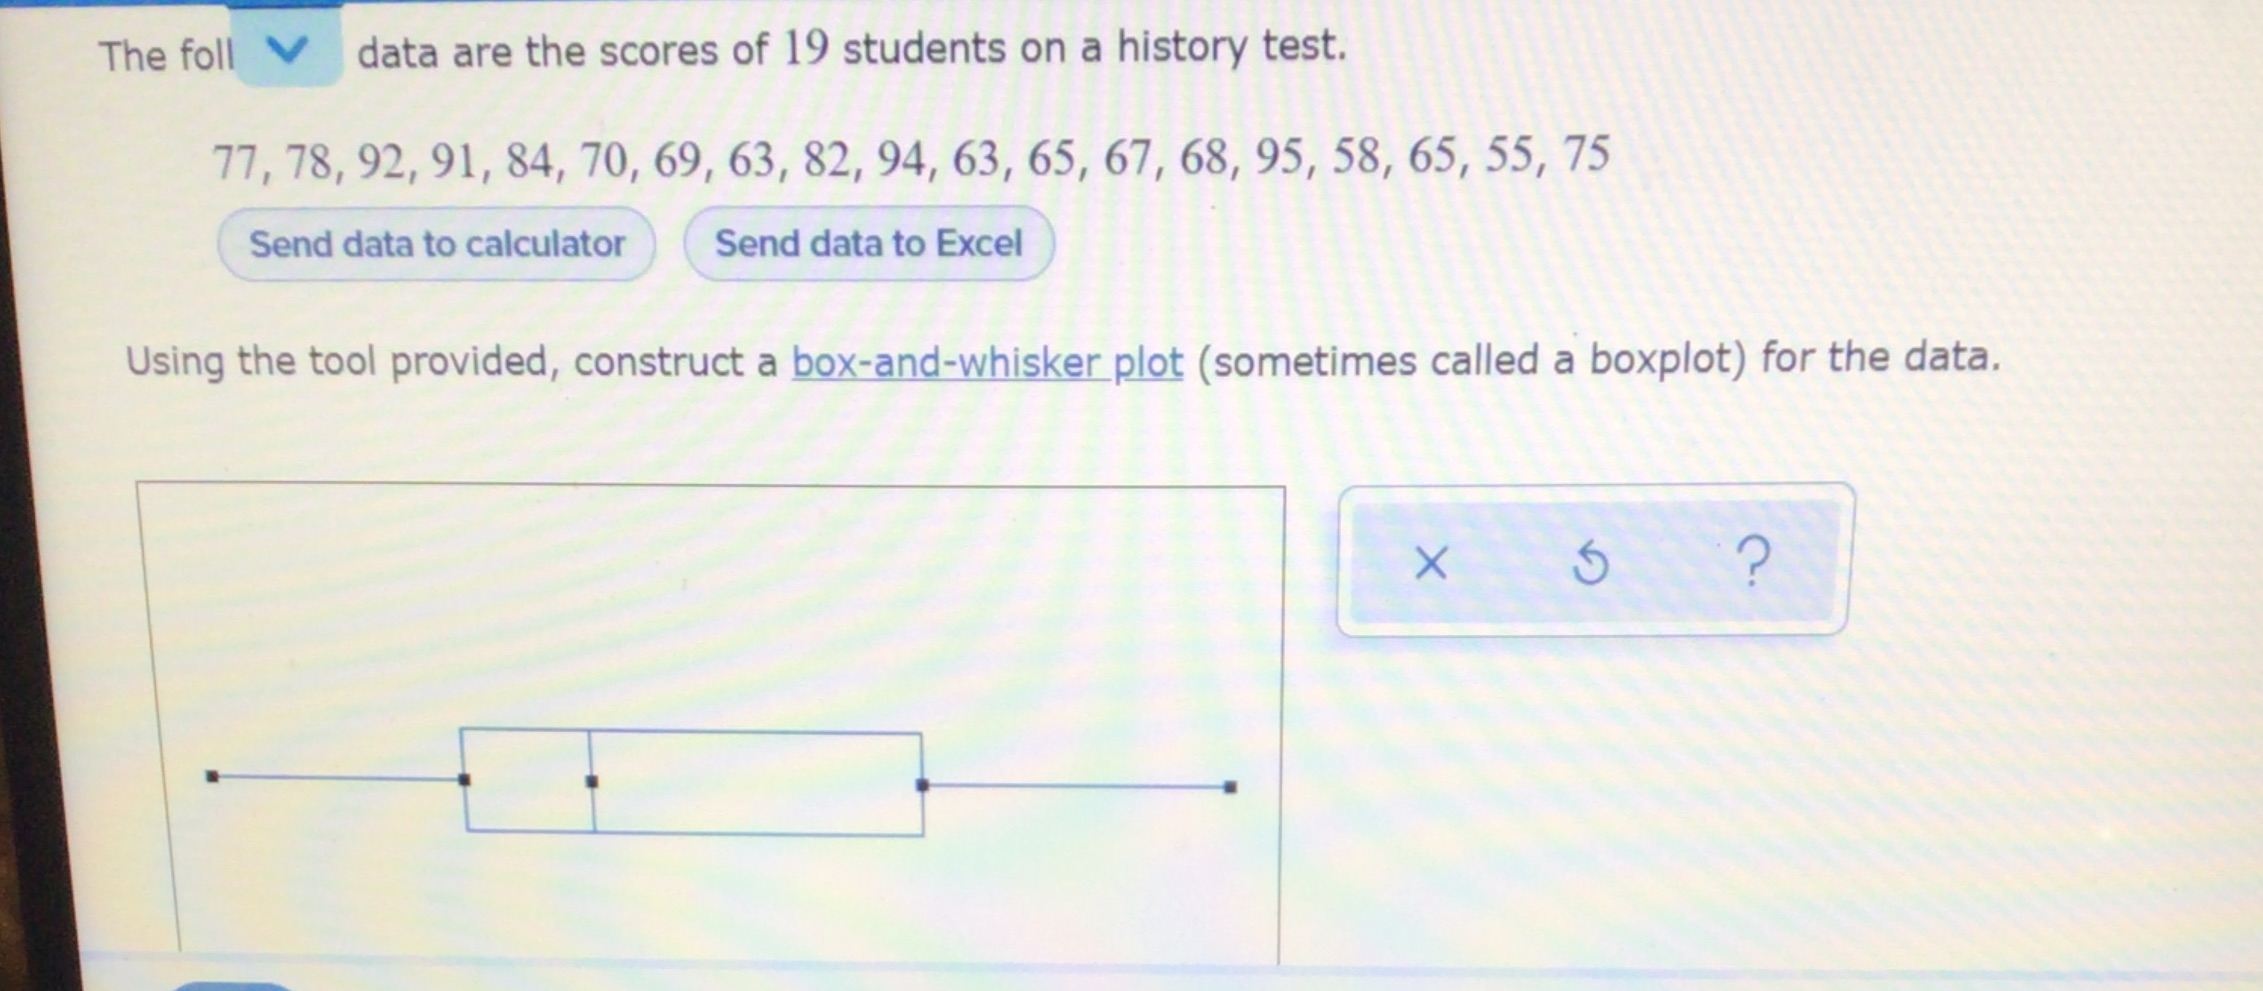
The foll V data are the scores of 19 students on a history test. 77, 78, 92, 91, 84, 70, 69, 63, 82, 94, 63, 65, 67, 68, 95, 58, 65, 55, 75 Send data to calculator Send data to Excel Using the tool provided, construct a box-and-whisker plot (sometimes called a boxplot) for the data. X
Step by Step Solution
There are 3 Steps involved in it
1 Expert Approved Answer
Step: 1 Unlock

Question Has Been Solved by an Expert!
Get step-by-step solutions from verified subject matter experts
Step: 2 Unlock
Step: 3 Unlock