

Question: The subgroup size is 9 and you are plotting continuous data. Which of the following control charts will you use
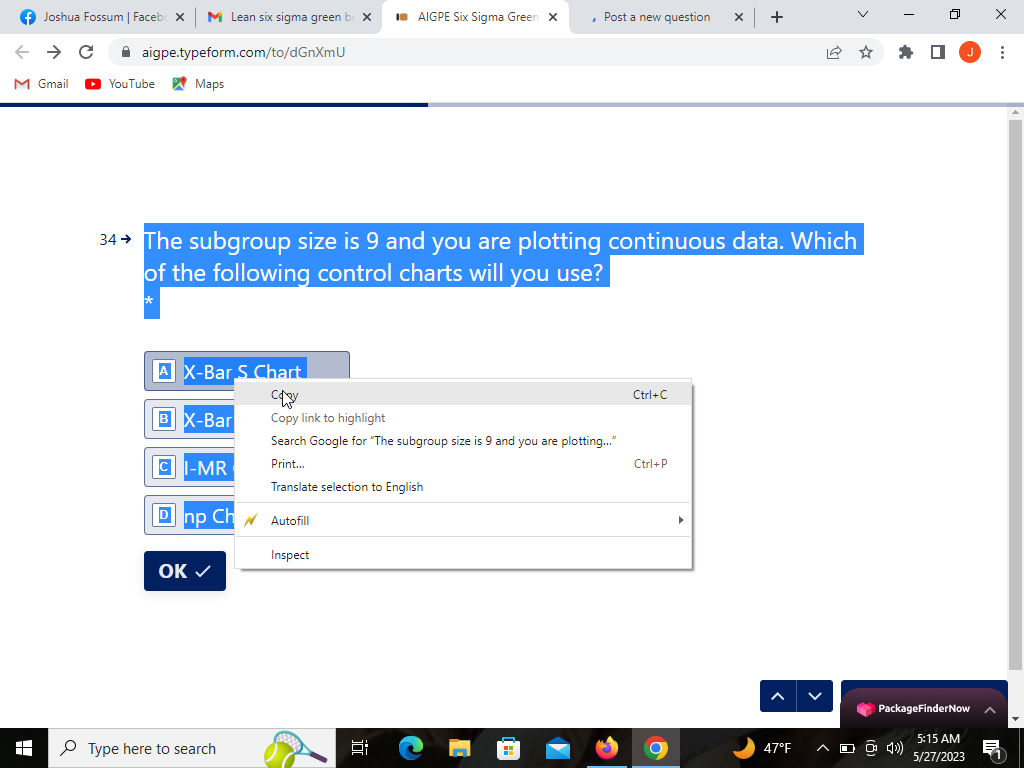
The subgroup size is 9 and you are plotting continuous data. Which of the following control charts will you use
Step by Step Solution
There are 3 Steps involved in it
1 Expert Approved Answer
Step: 1 Unlock

Question Has Been Solved by an Expert!
Get step-by-step solutions from verified subject matter experts
Step: 2 Unlock
Step: 3 Unlock