

Question: The system shown in Fig below is controlled by a proportional controller. The concentration of salt in solution leaving the tank is controlled by adding
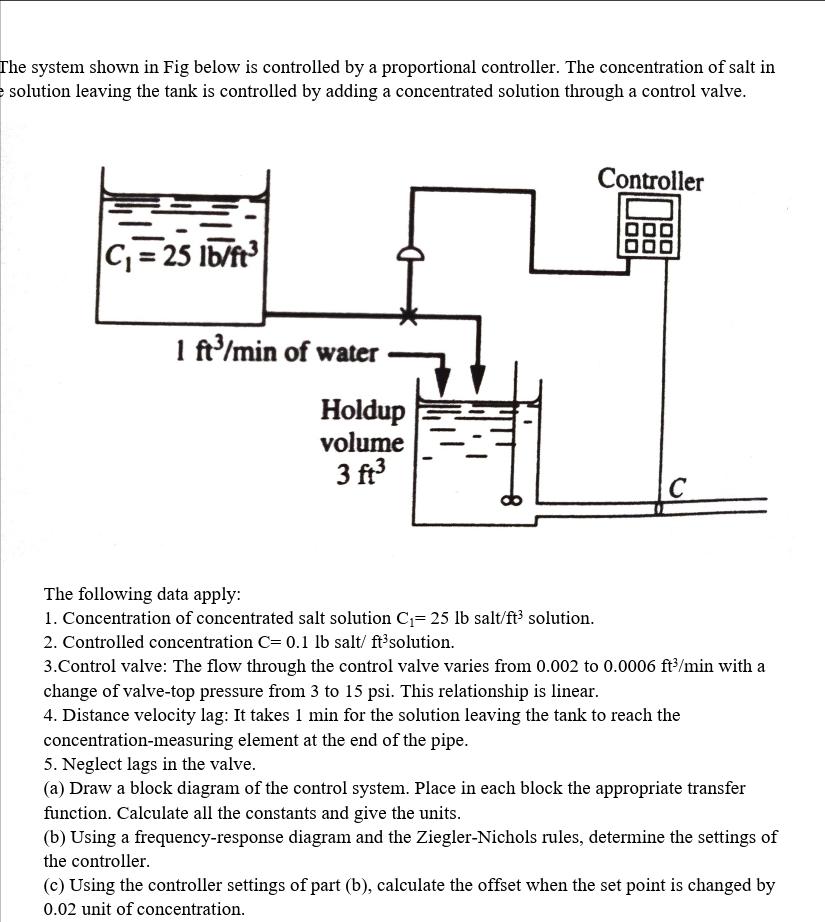
The system shown in Fig below is controlled by a proportional controller. The concentration of salt in solution leaving the tank is controlled by adding a concentrated solution through a control valve.
The following data apply:
Concentration of concentrated salt solution lbsal solution.
Controlled concentration salt solution.
Control valve: The flow through the control valve varies from to with a change of valvetop pressure from to This relationship is linear.
Distance velocity lag: It takes min for the solution leaving the tank to reach the concentrationmeasuring element at the end of the pipe.
Neglect lags in the valve.
a Draw a block diagram of the control system. Place in each block the appropriate transfer function. Calculate all the constants and give the units.
b Using a frequencyresponse diagram and the ZieglerNichols rules, determine the settings of the controller.
c Using the controller settings of part b calculate the offset when the set point is changed by unit of concentration.
Step by Step Solution
There are 3 Steps involved in it
1 Expert Approved Answer
Step: 1 Unlock

Question Has Been Solved by an Expert!
Get step-by-step solutions from verified subject matter experts
Step: 2 Unlock
Step: 3 Unlock