

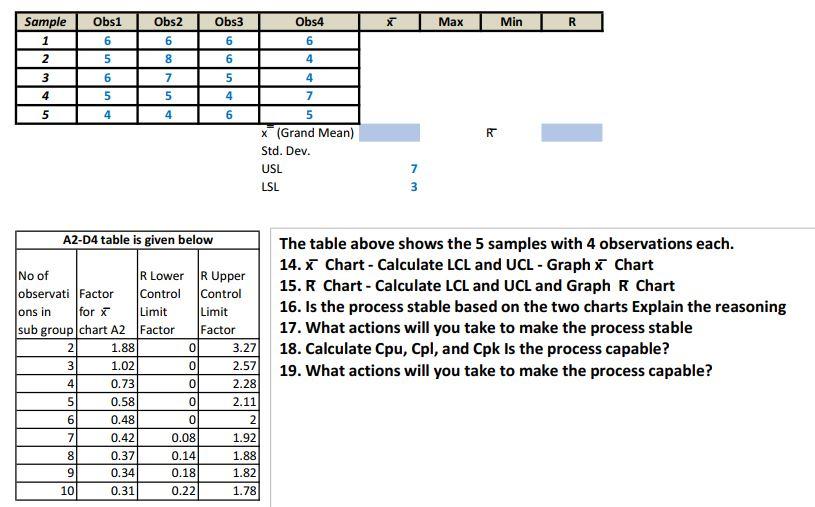
Question: The table above shows the 5 samples with 4 observations each. 14. x Chart - Calculate LCL and UCLGraphx Chart 15. R Chart - Calculate
Step by Step Solution
There are 3 Steps involved in it
1 Expert Approved Answer
Step: 1 Unlock

Question Has Been Solved by an Expert!
Get step-by-step solutions from verified subject matter experts
Step: 2 Unlock
Step: 3 Unlock