

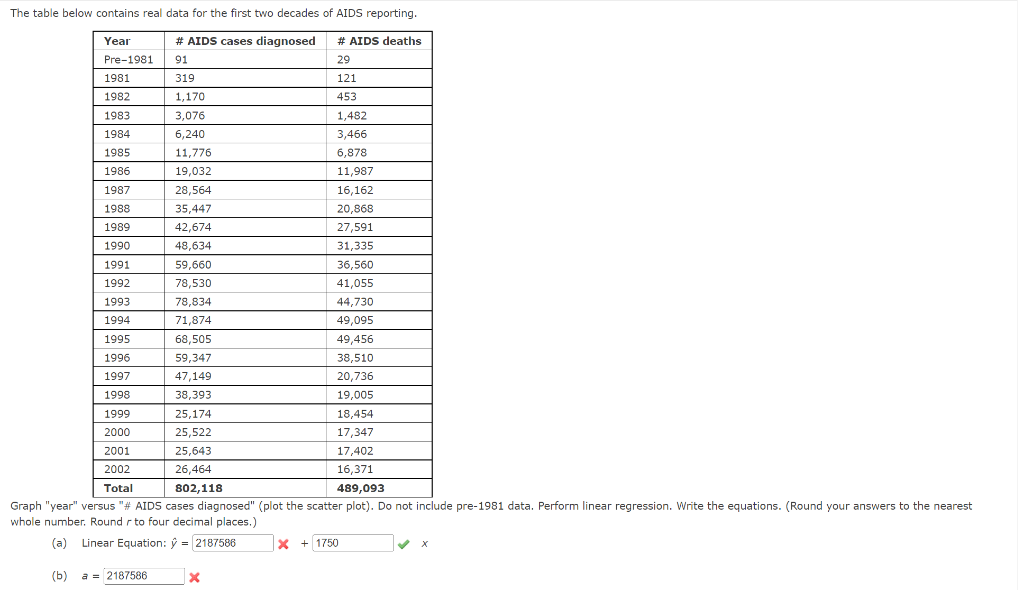
Question: The table below contains real data for the first two decades of AIDS reporting. Graph year versus # AIDS cases diagnosed (plot the scatter plot).
Step by Step Solution
There are 3 Steps involved in it
1 Expert Approved Answer
Step: 1 Unlock

Question Has Been Solved by an Expert!
Get step-by-step solutions from verified subject matter experts
Step: 2 Unlock
Step: 3 Unlock