

Question: The table below contains selected financial information from recent financial statements of KBI Toys and Little Tikes Adventure Toys, Inc., two toy manufacturing companies
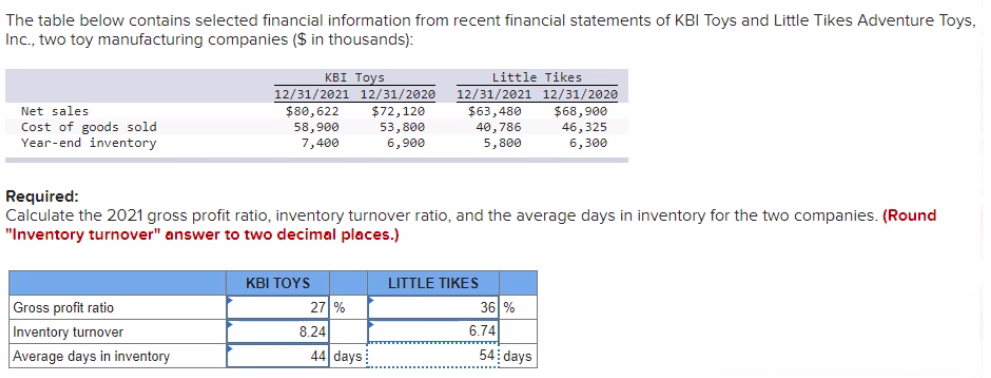
The table below contains selected financial information from recent financial statements of KBI Toys and Little Tikes Adventure Toys, Inc., two toy manufacturing companies ($ in thousands): Net sales Cost of goods sold Year-end inventory KBI Toys 12/31/2021 12/31/2020 Little Tikes 12/31/2021 12/31/2020 $80,622 58,900 7,400 $72,120 53,800 6,900 $63,480 $68,900 40,786 5,800 46,325 6,300 Required: Calculate the 2021 gross profit ratio, inventory turnover ratio, and the average days in inventory for the two companies. (Round "Inventory turnover" answer to two decimal places.) Gross profit ratio Inventory turnover Average days in inventory KBI TOYS LITTLE TIKES 27 % 36% 8.24 6.74 44 days 54 days
Step by Step Solution
There are 3 Steps involved in it

Get step-by-step solutions from verified subject matter experts