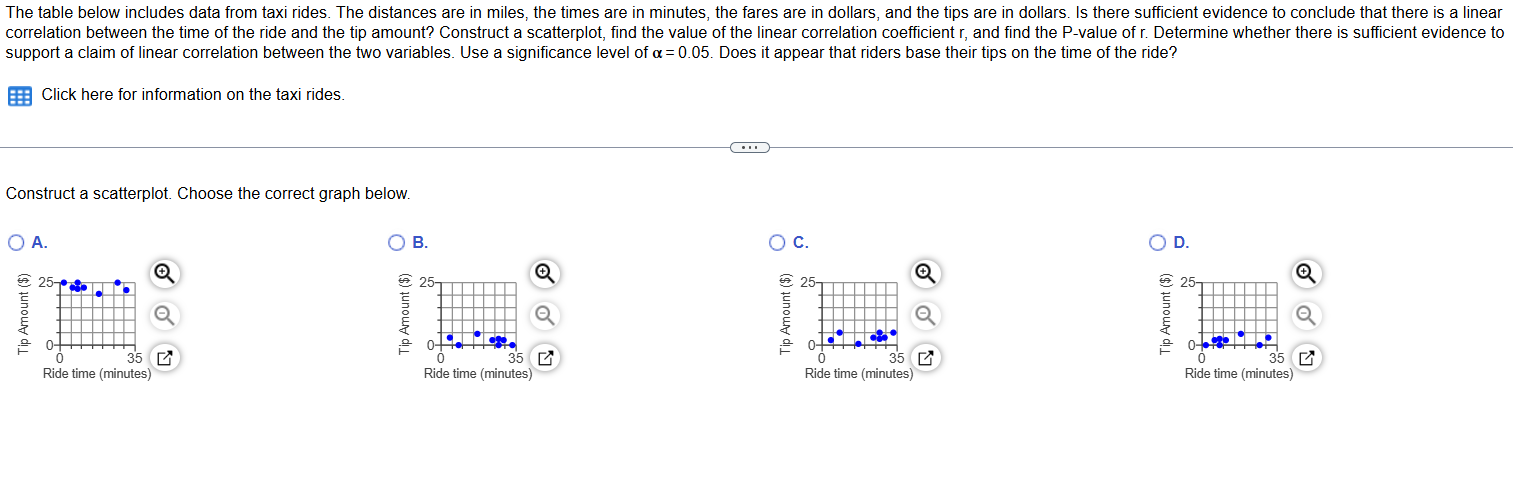
Question: The table below includes data from taxi rides. The distances are in miles, the times are in minutes, the fares are in dollars, and the

The table below includes data from taxi rides.
The table below includes data from taxi rides. The distances are in miles, the times are in minutes, the fares are in dollars, and the tips are in dollars. Is there sufficient evidence to conclude that there is a linear correlation between the time of the ride and the tip amount? Construct a scatterplot, find the value of the linear correlation coefficient r, and find the P-value of r. Determine whether there is sufficient evidence to support a claim of linear correlation between the two variables. Use a significance level of a = 0.05. Does it appear that riders base their tips on the time of the ride? Eff Click here for information on the taxi rides. Construct a scatterplot. Choose the correct graph below. O A. O B. O C. O D. 25 25- 25- Tip Amount ($) Tip Amount ($) Tip Amount ($) ofd 35 0 35 0 35 0 35 Ride time (minutes) Ride time (minutes) Ride time (minutes Ride time (minutes)

Step by Step Solution

There are 3 Steps involved in it

1 Expert Approved Answer
Step: 1 Unlock blur-text-image
Question Has Been Solved by an Expert!

Get step-by-step solutions from verified subject matter experts

Step: 2 Unlock
Step: 3 Unlock

Students Have Also Explored These Related Accounting Questions!