

Question: The table below is from the paper by Terrence Odean (1998) that describes the tendency for traders to sell winners but hold on to losers.
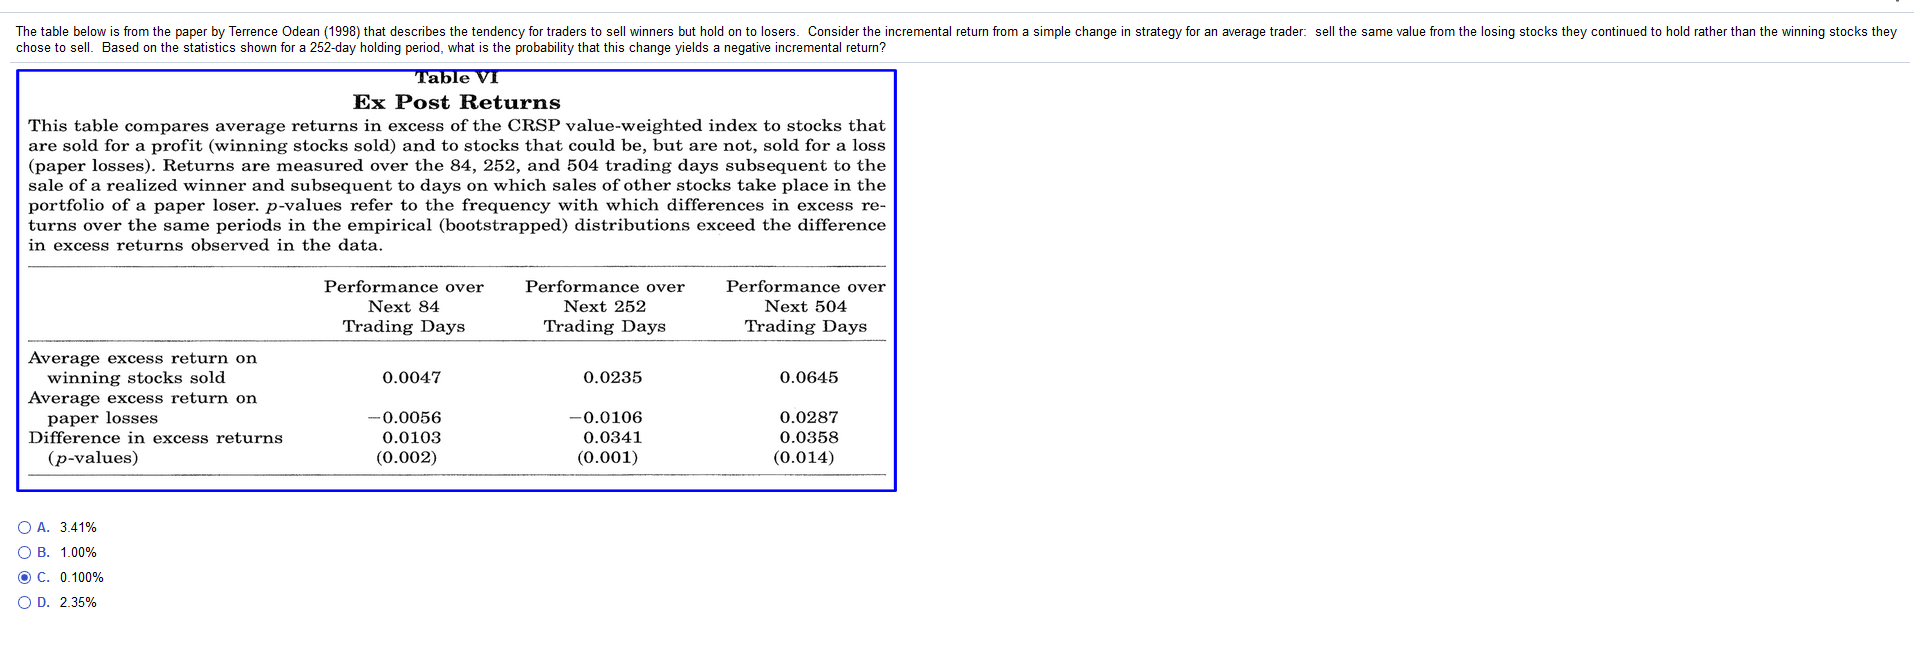
The table below is from the paper by Terrence Odean (1998) that describes the tendency for traders to sell winners but hold on to losers. Consider the incremental return from a simple change in strategy for an average trader: sell the same value from the losing stocks they continued to hold rather than the winning stocks they chose to sell. Based on the statistics shown for a 252-day holding period, what is the probability that this change yields a negative incremental return? Table VI Ex Post Returns This table compares average returns in excess of the CRSP value-weighted index to stocks that are sold for a profit (winning stocks sold) and to stocks that could be, but are not, sold for a loss (paper losses). Returns are measured over the 84, 252, and 504 trading days subsequent to the sale of a realized winner and subsequent to days on which sales of other stocks take place in the portfolio of a paper loser. p-values refer to the frequency with which differences in excess re- turns over the same periods in the empirical (bootstrapped) distributions exceed the difference in excess returns observed in the data. Performance over Next 84 Trading Days Performance over Next 252 Trading Days Performance over Next 504 Trading Days 0.0047 0.0235 0.0645 Average excess return on winning stocks sold Average excess return on paper losses Difference in excess returns (p-values) -0.0056 0.0103 (0.002) -0.0106 0.0341 (0.001) 0.0287 0.0358 (0.014) O A. 3.41% OB. 1.00% OC. 0.100% OD. 2.35% The table below is from the paper by Terrence Odean (1998) that describes the tendency for traders to sell winners but hold on to losers. Consider the incremental return from a simple change in strategy for an average trader: sell the same value from the losing stocks they continued to hold rather than the winning stocks they chose to sell. Based on the statistics shown for a 252-day holding period, what is the probability that this change yields a negative incremental return? Table VI Ex Post Returns This table compares average returns in excess of the CRSP value-weighted index to stocks that are sold for a profit (winning stocks sold) and to stocks that could be, but are not, sold for a loss (paper losses). Returns are measured over the 84, 252, and 504 trading days subsequent to the sale of a realized winner and subsequent to days on which sales of other stocks take place in the portfolio of a paper loser. p-values refer to the frequency with which differences in excess re- turns over the same periods in the empirical (bootstrapped) distributions exceed the difference in excess returns observed in the data. Performance over Next 84 Trading Days Performance over Next 252 Trading Days Performance over Next 504 Trading Days 0.0047 0.0235 0.0645 Average excess return on winning stocks sold Average excess return on paper losses Difference in excess returns (p-values) -0.0056 0.0103 (0.002) -0.0106 0.0341 (0.001) 0.0287 0.0358 (0.014) O A. 3.41% OB. 1.00% OC. 0.100% OD. 2.35%
Step by Step Solution
There are 3 Steps involved in it

Get step-by-step solutions from verified subject matter experts