

Question: The table below presents BOP data for China and the US in 2010. BOP Data for China and the US Source: IMF data. us China

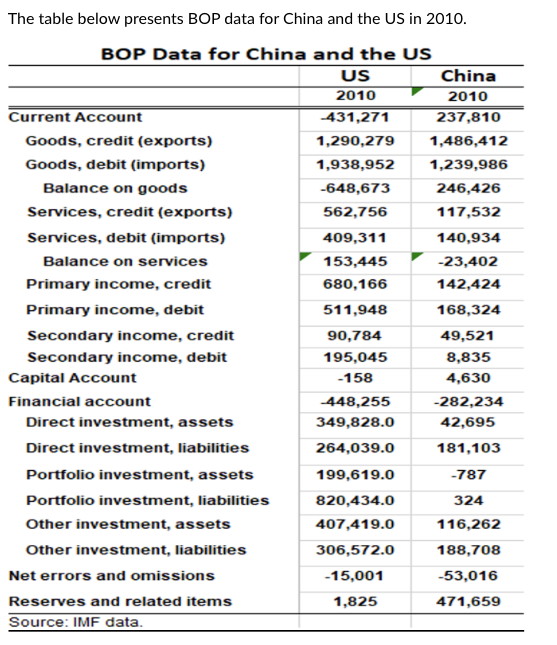
The table below presents BOP data for China and the US in 2010. BOP Data for China and the US Source: IMF data. us China - 2010 " 2010 Current Account | 431,271 237,810 Goods, credit (exports) 1,290,279 1,486,412 Goods, debit (imports) 1,938,952 1,239,986 Balance on goods -648,673 246, 426 Services, credit (exports) 562,756 117,532 Services, debit (imports) 409,311 140,934 Balance on services 153,445 -23,402 Primary income, credit 680,166 142,424 Primary income, debit 511,948 168,324 Secondary income, credit 90,784 49.521 Secondary income, debit 195,045 8,835 Capital Account -158 4,630 Financial account -448 255 -282.234 Direct investment, assets 349.828.0 42 695 Direct investment, liabilities 264,039.0 181,103 Portfolio investment, assels 199,619.0 -787 Portfolio investment, liabilities 820,434.0 324 Other investment, assets 407.419.0 116,262 Other investment, liabilities 306,572.0 188,708 Net errors and omissions -15,001 -53,016 Reserves and related items 1,825 471,659
Step by Step Solution
There are 3 Steps involved in it

Get step-by-step solutions from verified subject matter experts