

Question: The table below presents data on green liquor NazS concentration (in grams per liter) and paper machine production (in tons per day). y X 48
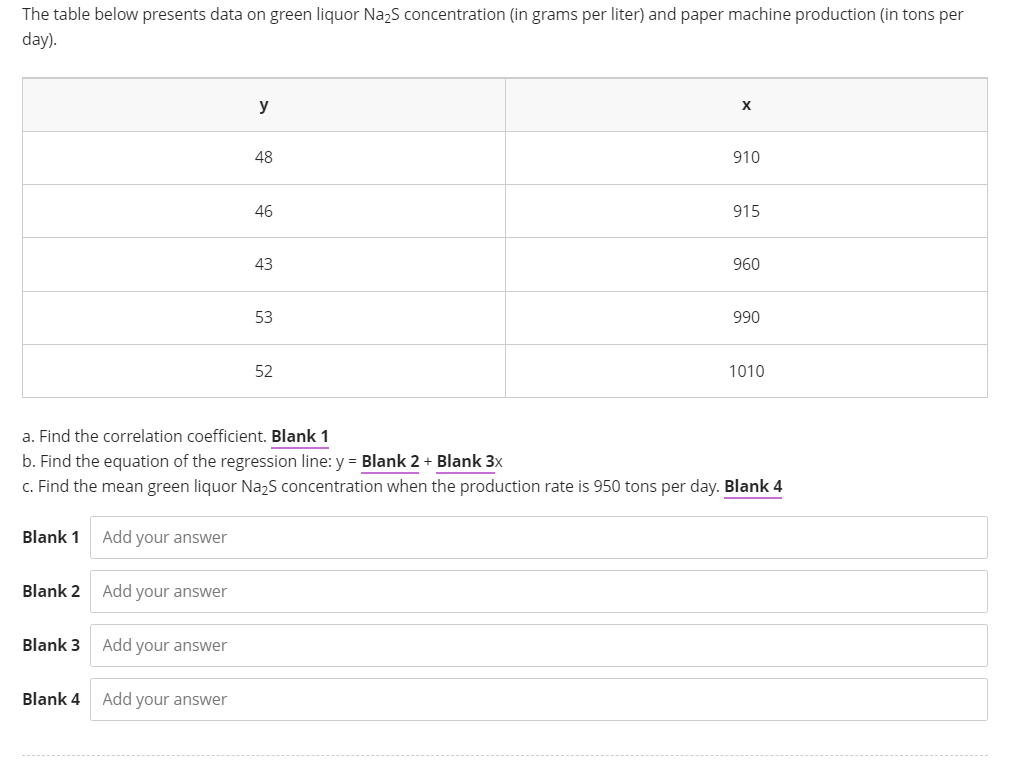
The table below presents data on green liquor NazS concentration (in grams per liter) and paper machine production (in tons per day). y X 48 910 46 915 43 960 53 990 52 1010 a. Find the correlation coefficient. Blank 1 b. Find the equation of the regression line: y = Blank 2 + Blank 3x c. Find the mean green liquor NazS concentration when the production rate is 950 tons per day. Blank 4 Blank 1 Add your answer Blank 2 Add your answer Blank 3 Add your answer Blank 4 Add your
Step by Step Solution
There are 3 Steps involved in it
1 Expert Approved Answer
Step: 1 Unlock

Question Has Been Solved by an Expert!
Get step-by-step solutions from verified subject matter experts
Step: 2 Unlock
Step: 3 Unlock