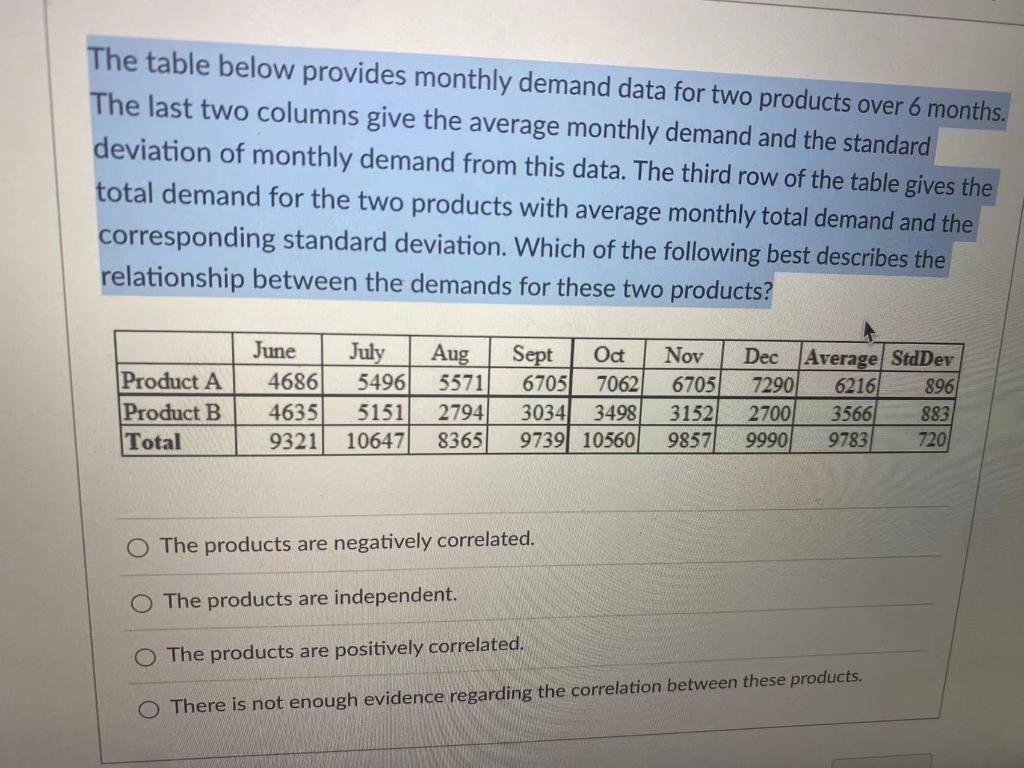
Question: The table below provides monthly demand data for two products over 6 months. The last two columns give the average monthly demand and the standard

The table below provides monthly demand data for

The table below provides monthly demand data for two products over 6 months. The last two columns give the average monthly demand and the standard deviation of monthly demand from this data. The third row of the table gives the total demand for the two products with average monthly total demand and the corresponding standard deviation. Which of the following best describes the relationship between the demands for these two products? Product A Product B Total June 4686 4635 9321 July 5496 5151 10647 Aug 5571 2794 8365 Sept Oct 6705 7062 3034 3498 9739 10560 Nov 6705 3152 9857 Dec Average StdDer 7290 6216) 896 2700 3566 883 9990 9783 7201 O. The products are negatively correlated. The products are independent. The products are positively correlated. O There is not enough evidence regarding the correlation between these products

Step by Step Solution

There are 3 Steps involved in it

1 Expert Approved Answer
Step: 1 Unlock blur-text-image
Question Has Been Solved by an Expert!

Get step-by-step solutions from verified subject matter experts

Step: 2 Unlock
Step: 3 Unlock

Students Have Also Explored These Related General Management Questions!