

Question: The table below represents a sample of the amount (in RM) shown on electricity bills during the month of April 2020 88 92 97
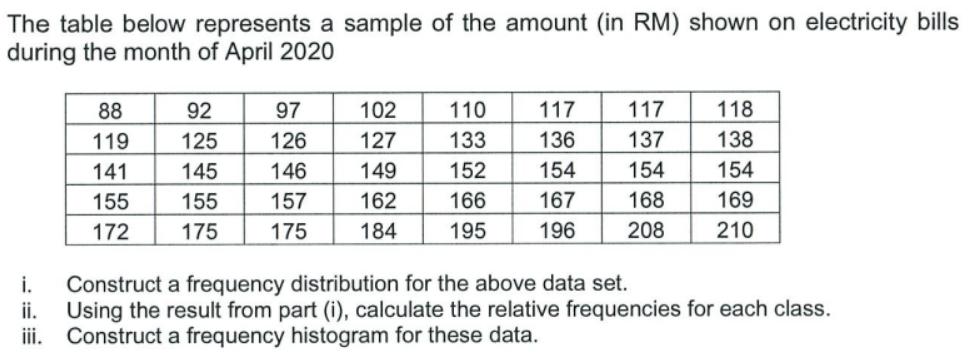
The table below represents a sample of the amount (in RM) shown on electricity bills during the month of April 2020 88 92 97 102 110 117 117 118 119 125 126 127 133 136 137 138 141 145 146 149 152 154 154 154 155 155 157 162 166 167 168 169 172 175 175 184 195 196 208 210 i. Construct a frequency distribution for the above data set. ii. Using the result from part (i), calculate the relative frequencies for each class. ii. Construct a frequency histogram for these data.
Step by Step Solution
3.48 Rating (161 Votes )
There are 3 Steps involved in it
88 92 97 102 110 117 117 118 119 125 126 127 133 136 137 138 141 145 146 149 152 154 154 154 1... View full answer

Get step-by-step solutions from verified subject matter experts