

Question: The Table below shows data on the returns over five 1-year periods for six mutual funds. A firm's portfolio managers will assume that one of
The Table below shows data on the returns over five 1-year periods for six mutual funds. A firm's portfolio managers will assume that one of these scenarios will accurately reflect the investing climate over the next 12 months. The probabilities of each of the scenarios occurring are 0.1,0.3,0.1,0.1, and 0.4 for years 1 to 5 , respectively. a. Develop a portfolio model for investors who are willing to risk a portfolio with a return no lower than 2%. b. Solve the model in part (a) and recommend a portfolio allocation for the investor with this risk tolerance. Modify the portfolio model in part (a) and solve it to develop a portfolio for an investor with a risk tolerance of 0%. d. Is the expected return higher for investors following the portfolio recommendations in part (c) as compared to the returns for the portfolio in part (b)? If so, do you believe the returns are enough higher to justify investing in that portfolio? e. What is the best worst case guaranteed return? Please show the revised formulation and solve. TABLE 5.11 RETURNS OVER FIVE 1-YEAR PERIODS FOR SIX MUTUAL FUNDS
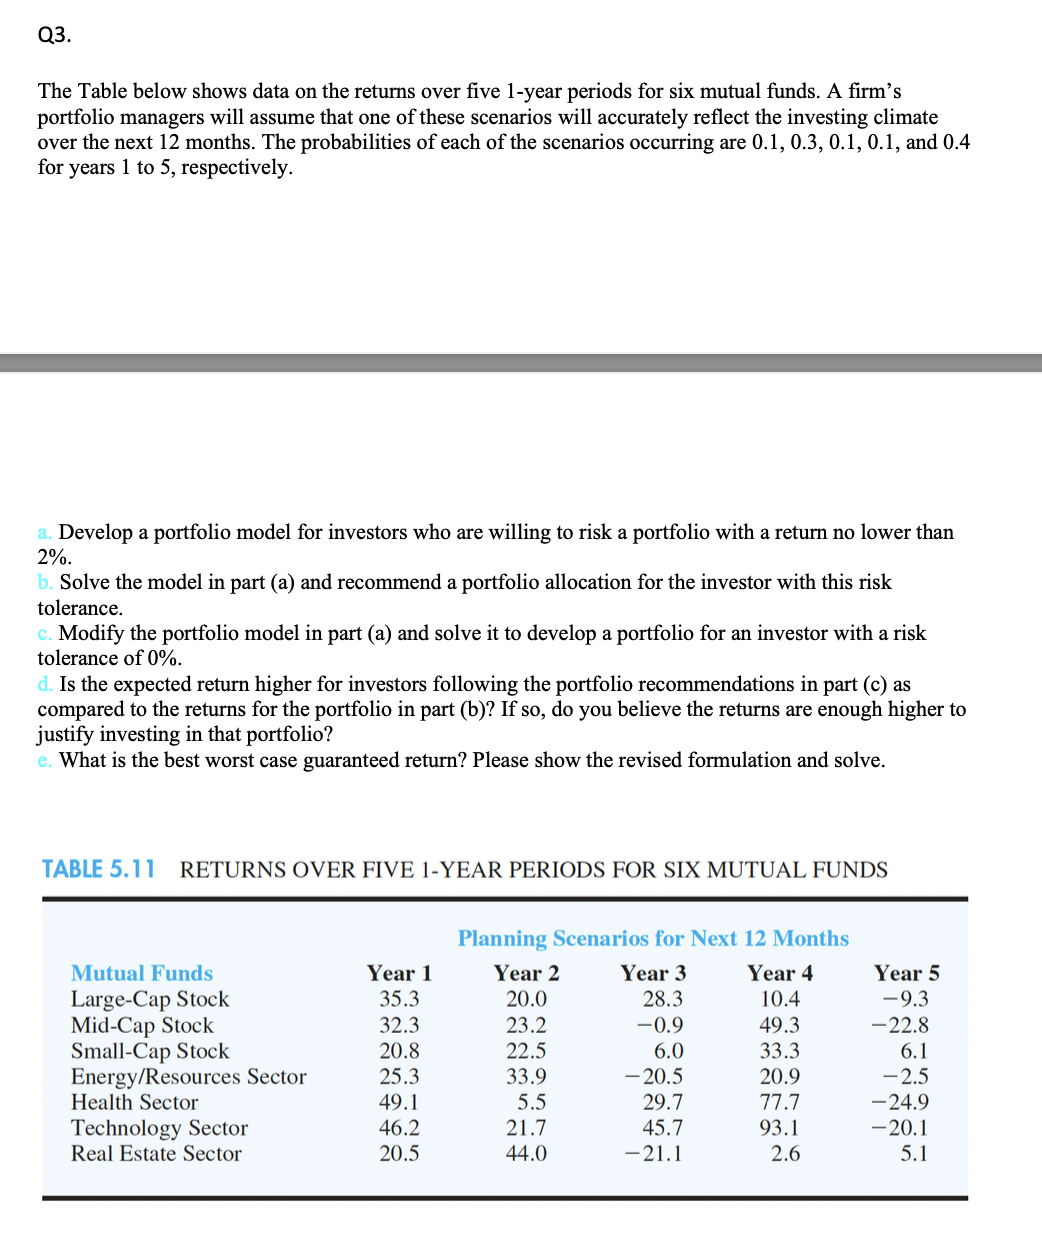
Q3. The Table below shows data on the returns over five 1-year periods for six mutual funds. A firm's portfolio managers will assume that one of these scenarios will accurately reflect the investing climate over the next 12 months. The probabilities of each of the scenarios occurring are 0.1, 0.3, 0.1, 0.1, and 0.4 for years 1 to 5, respectively. a. Develop a portfolio model for investors who are willing to risk a portfolio with a return no lower than 2%. b. Solve the model in part (a) and recommend a portfolio allocation for the investor with this risk tolerance. c. Modify the portfolio model in part (a) and solve it to develop a portfolio for an investor with a risk tolerance of 0%. d. Is the expected return higher for investors following the portfolio recommendations in part (c) as compared to the returns for the portfolio in part (b)? If so, do you believe the returns are enough higher to justify investing in that portfolio? e. What is the best worst case guaranteed return? Please show the revised formulation and solve. TABLE 5.11 RETURNS OVER FIVE 1-YEAR PERIODS FOR SIX MUTUAL FUNDS Planning Scenarios for Next 12 Months Mutual Funds Year 1 Year 2 Year 3 Year 4 Year 5 Large-Cap Stock 35.3 20.0 28.3 10.4 -9.3 Mid-Cap Stock 32.3 23.2 -0.9 49.3 -22.8 Small-Cap Stock 20.8 22.5 6.0 33.3 6.1 Energy/Resources Sector 25.3 33.9 -20.5 20.9 -2.5 Health Sector 49.1 5.5 29.7 77.7 -24.9 Technology Sector 46.2 21.7 45.7 93.1 -20.1 Real Estate Sector 20.5 44.0 -21.1 2.6 5.1
Step by Step Solution
There are 3 Steps involved in it
To analyze and answer the question thoroughly I will need to extract the data from the table in the ... View full answer

Get step-by-step solutions from verified subject matter experts