

Question: The table below shows data over several years for a country's real GDP, the number of full-time employed workers (E), and the annual average number
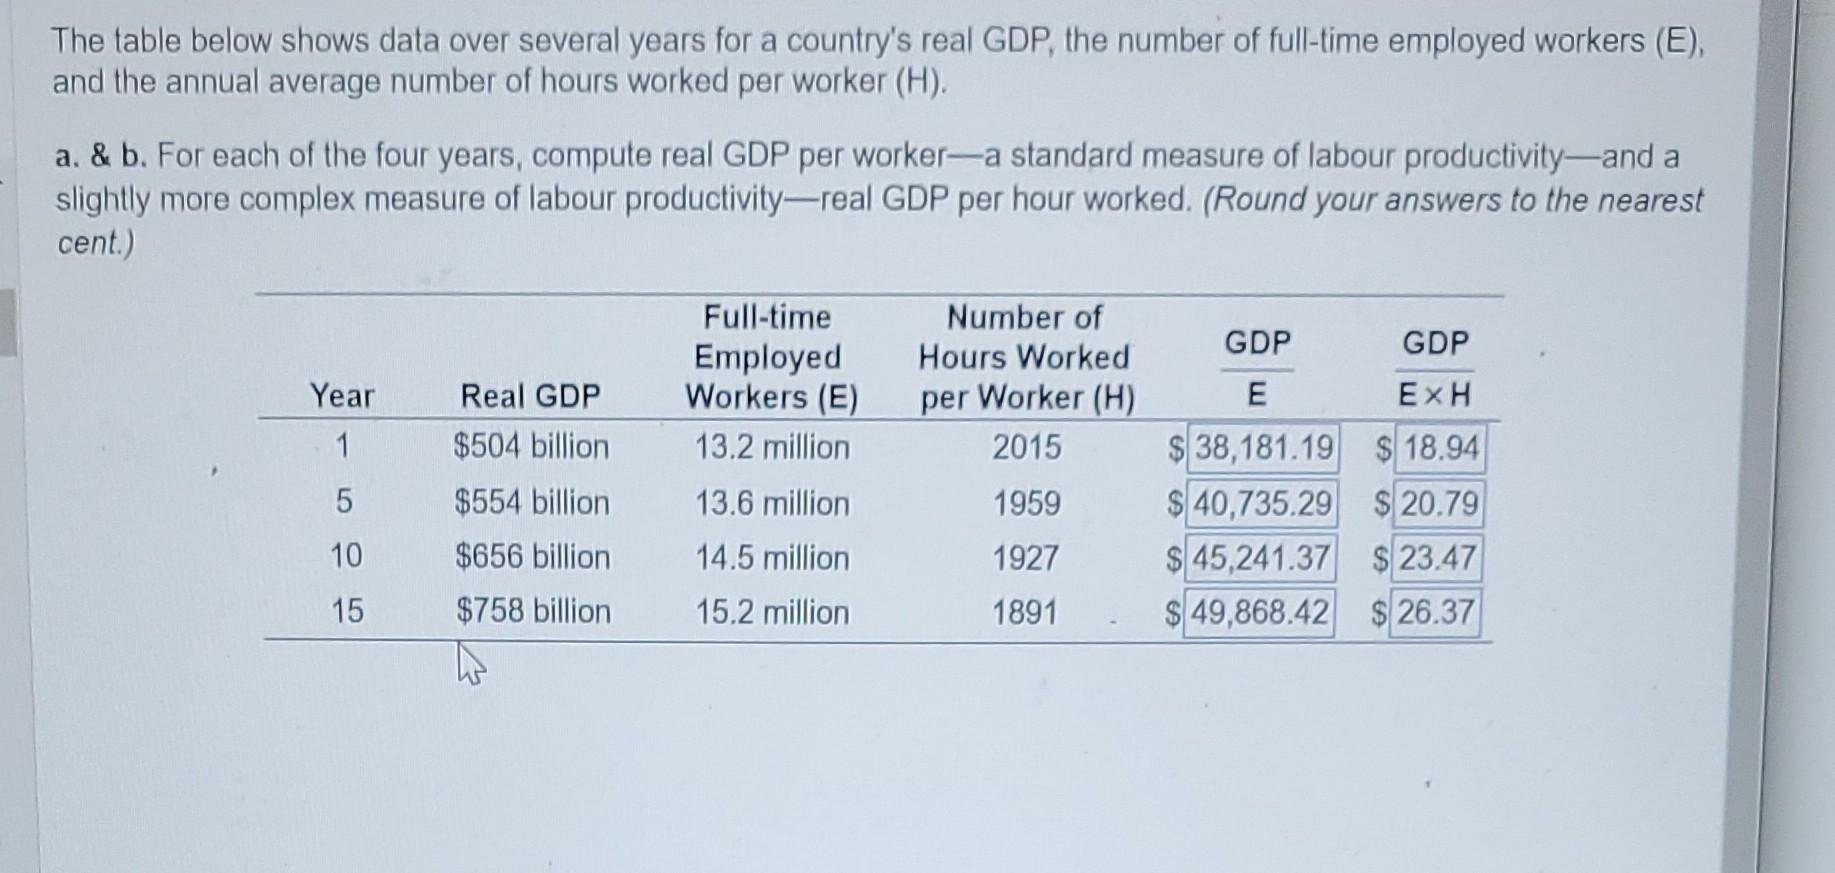
The table below shows data over several years for a country's real GDP, the number of full-time employed workers (E), and the annual average number of hours worked per worker (H). a. & b. For each of the four years, compute real GDP per worker-a standard measure of labour productivity-and a slightly more complex measure of labour productivity-real GDP per hour worked. (Round your answers to the nearest cent.) Full-time Number of Employed Hours Worked GDP GDP Year Real GDP Workers (E) per Worker (H) E EXH 1 $504 billion 13.2 million 2015 $ 38, 181.19 $ 18.94 5 $554 billion 13.6 million 1959 $ 40,735.29 $ 20.79 10 $656 billion 14.5 million 1927 $ 45,241.37 $ 23.47 15 $758 billion 15.2 million 1891 $ 49,868.42 $ 26.37
Step by Step Solution
There are 3 Steps involved in it

Get step-by-step solutions from verified subject matter experts