

Question: The table below shows data over several years for a country's real GDP, the number of full-time employed workers (E), and the annual average
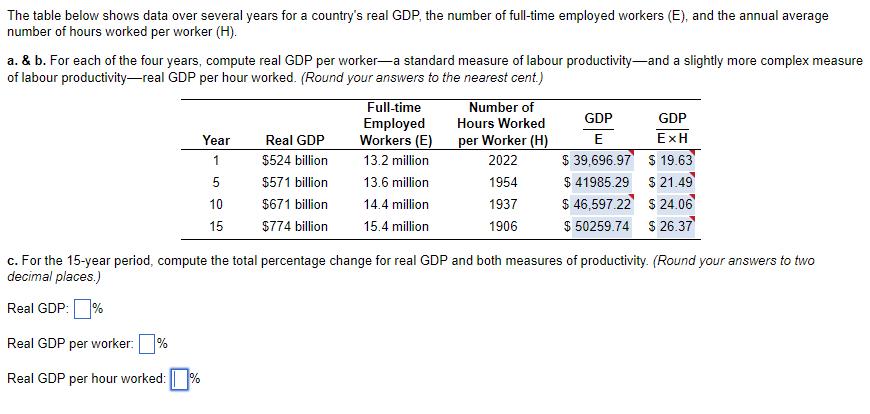
The table below shows data over several years for a country's real GDP, the number of full-time employed workers (E), and the annual average number of hours worked per worker (H). a. & b. For each of the four years, compute real GDP per worker-a standard measure of labour productivity and a slightly more complex measure of labour productivity-real GDP per hour worked. (Round your answers to the nearest cent.) Year 1 5 10 15 Real GDP $524 billion $571 billion $671 billion $774 billion Full-time Employed Workers (E) 13.2 million 13.6 million 14.4 million 15.4 million Number of Hours Worked per Worker (H) 2022 1954 1937 1906 GDP GDP E EXH $ 39,696.97 $ 19.63 $ 41985.29 $46,597.22 $21.49 $24.06 $ 50259.74 $ 26.37 c. For the 15-year period, compute the total percentage change for real GDP and both measures of productivity. (Round your answers to two decimal places.) Real GDP:% Real GDP per worker: % Real GDP per hour worked: %
Step by Step Solution
There are 3 Steps involved in it
To calculate the percentage change over the 15year period you can use the following formula textPerc... View full answer

Get step-by-step solutions from verified subject matter experts