

Question: The table below shows data recorded during an oedometer test on a soil sample for an increment of vertical stress of 2 0 0 kPa.
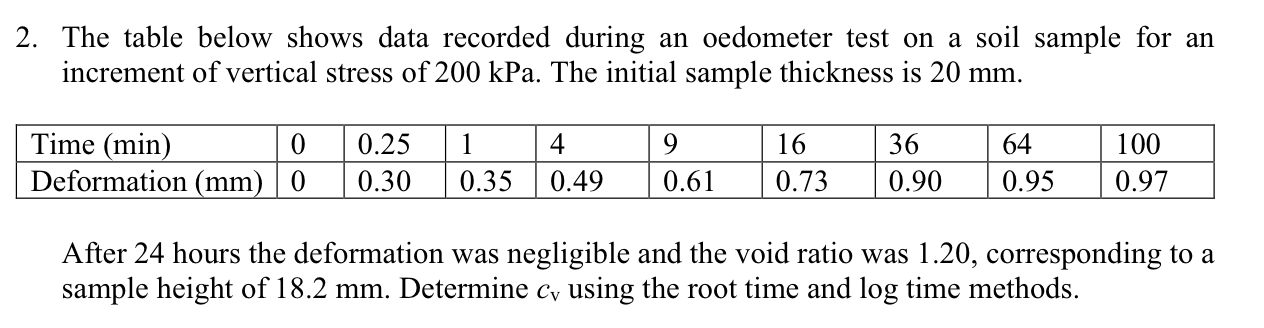
The table below shows data recorded during an oedometer test on a soil sample for an increment of vertical stress of kPa. The initial sample thickness is
tableTime minDeformation mm
After hours the deformation was negligible and the void ratio was corresponding to a sample height of Determine using the root time and log time methods.
Step by Step Solution
There are 3 Steps involved in it
1 Expert Approved Answer
Step: 1 Unlock

Question Has Been Solved by an Expert!
Get step-by-step solutions from verified subject matter experts
Step: 2 Unlock
Step: 3 Unlock