

Question: The table below shows standard deviations and correlation coefficients for seven stocks from different countries. Calculate the variance of a portfolio with equal investments in
The table below shows standard deviations and correlation coefficients for seven stocks from different countries. Calculate the variance of a portfolio with equal investments in each stock. (Use decimals, not percents, in your calculations. Do not round intermediate calculations. Round your answer to 4 decimal places.)
| BHP Billiton | Siemens | Nestl | LVMH | Toronto Dominion Bank | Samsung | BP | |||||||||
| BHP Billiton | 1.00 | 0.26 | 0.40 | 0.41 | 0.16 | 0.41 | 0.18 | ||||||||
| Siemens | 1.00 | 0.28 | 0.16 | 0.18 | 0.35 | 0.08 | |||||||||
| Nestl | 1.00 | 0.05 | 0.06 | -0.02 | 0.06 | ||||||||||
| LVMH | 1.00 | 0.37 | 0.55 | 0.11 | |||||||||||
| Toronto Dominion Bank | 1.00 | 0.14 | 0.14 | ||||||||||||
| Samsung | 1.00 | 0.13 | |||||||||||||
| BP | 1.00 | ||||||||||||||
| Standard deviation (%) | 29.00 | 40.80 | 51.80 | 27.30 | 21.00 | 41.50 | 49.40 | ||||||||
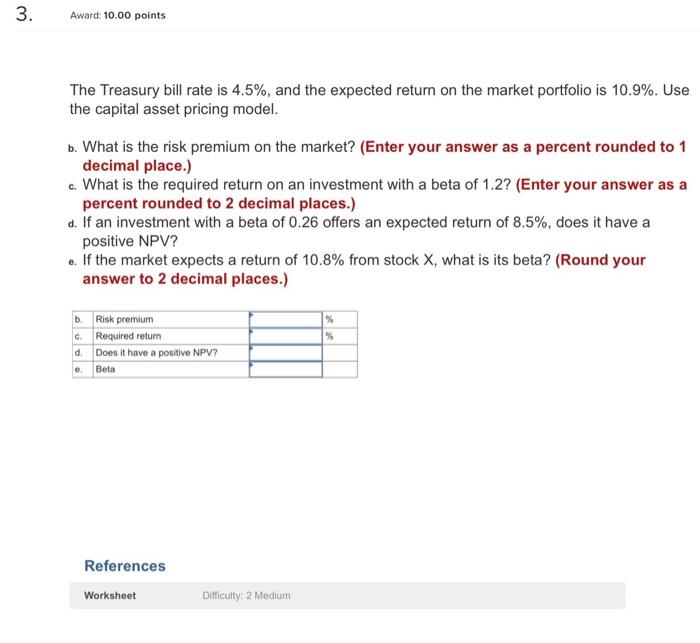
3. Award. 10.00 points The Treasury bill rate is 4.5%, and the expected return on the market portfolio is 10.9%. Use the capital asset pricing model. b. What is the risk premium on the market? (Enter your answer as a percent rounded to 1 decimal place.) c. What is the required return on an investment with a beta of 1.2? (Enter your answer as a percent rounded to 2 decimal places.) a. If an investment with a beta of 0.26 offers an expected return of 8.5%, does it have a positive NPV? e. If the market expects a return of 10.8% from stock X, what is its beta? (Round your answer to 2 decimal places.) b. % % Risk premium c. Required return d. Does it have a positive NPV? Beta e References Worksheet Difficulty: 2 Medium
Step by Step Solution
There are 3 Steps involved in it

Get step-by-step solutions from verified subject matter experts