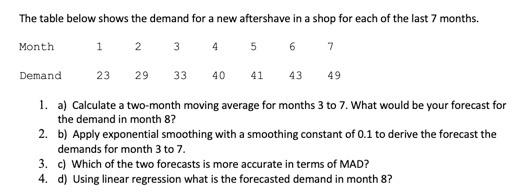
Question: The table below shows the demand for a new aftershave in a shop for each of the last 7 months. Month 1 2 3 4

The table below shows the demand for a new
The table below shows the demand for a new aftershave in a shop for each of the last 7 months. Month 1 2 3 4 Demand 23 29 33 40 41 43 49 1. a) Calculate a two-month moving average for months 3 to 7. What would be your forecast for the demand in month 8? 2. b) Apply exponential smoothing with a smoothing constant of 0.1 to derive the forecast the demands for month 3 to 7. 3. c) Which of the two forecasts is more accurate in terms of MAD? 4. d) Using linear regression what is the forecasted demand in month 8

Step by Step Solution

There are 3 Steps involved in it

1 Expert Approved Answer
Step: 1 Unlock blur-text-image
Question Has Been Solved by an Expert!

Get step-by-step solutions from verified subject matter experts

Step: 2 Unlock
Step: 3 Unlock

Students Have Also Explored These Related General Management Questions!