

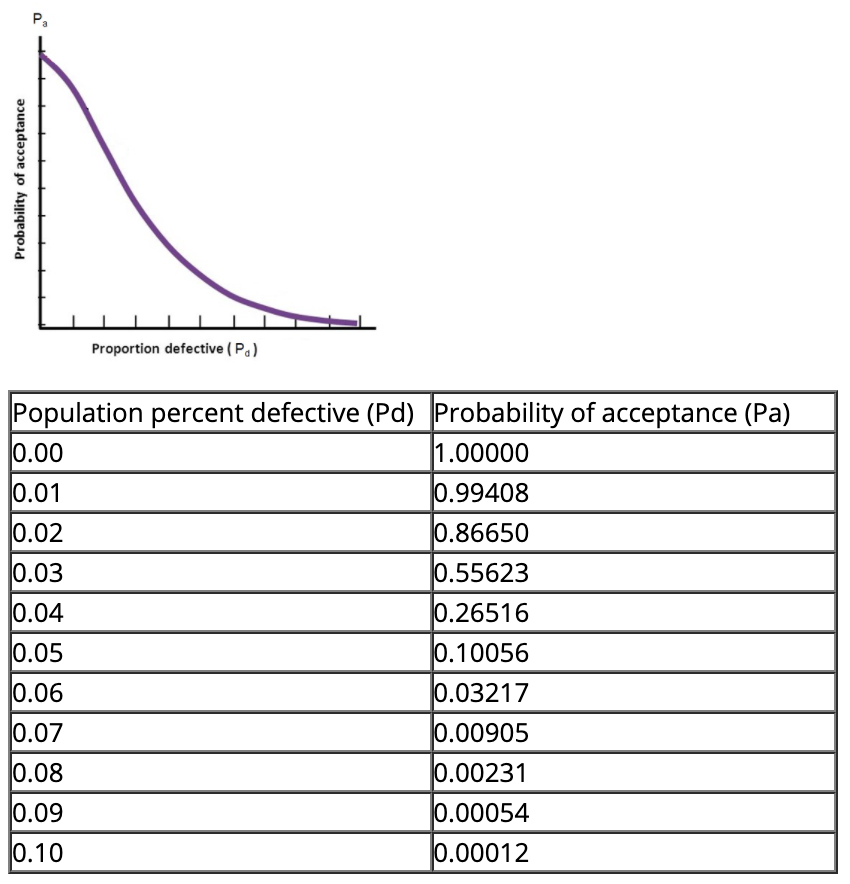
Question: The table below shows the selected values of the OC curve for the acceptance sampling plan n=6. Upon failed inspection, defective items are replaced. A)
The table below shows the selected values of the OC curve for the acceptance sampling plan n=6.
Upon failed inspection, defective items are replaced.
A) Calculate the AOQ for each data point assuming the batch size (N) is much larger than the sample size (n).

B) Plot the AOQ curve
C) At approximately what defective rate (Pd) is the AOQ at its worst (highest)? Is this a good plan if the desired specifications are AQL = 0.015, =. 0.05, LTPD = 0.05, = 0.10 (how well does this plan satisfy targeted and )?
Step by Step Solution
There are 3 Steps involved in it
1 Expert Approved Answer
Step: 1 Unlock

Question Has Been Solved by an Expert!
Get step-by-step solutions from verified subject matter experts
Step: 2 Unlock
Step: 3 Unlock