

Question: The table below shows the total amount spent, in billions of dollars, on tobacco products in the US. a. Find the average rate of change
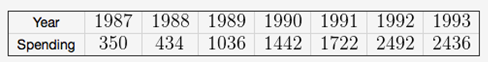
The table below shows the total amount spent, in billions of dollars, on tobacco products in the US.
a. Find the average rate of change in the amount spent on tobacco products between 1990 and 1992. Give
![]()
b. During this six-year period, select the one-year intervals during which the average rate of change was negative?
A. Between 1987 and 1988
B. Between 1988 and 1989
C. Between 1989 and 1990
D. Between 1990 and 1991
E. Between 1991 and 1992
F. Between 1992 and 1993
G. None of these above
Year 1987 1988 1989 Spending 350 434 1036 1990 1991 1992 1993 1442 1722 2492 2436 Answer: The average rate of change = and its units = ?
Step by Step Solution
3.48 Rating (164 Votes )
There are 3 Steps involved in it
To find the solutions lets address each part separately Part a Average Rate of Change from 1990 to 1... View full answer

Get step-by-step solutions from verified subject matter experts