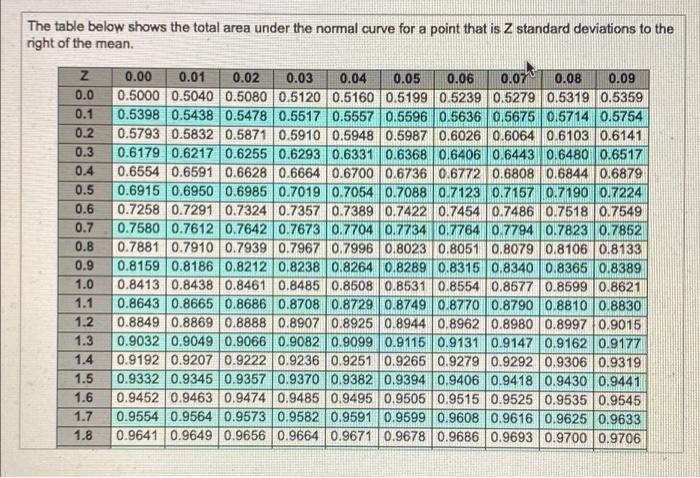
Question: The table below shows the total area under the normal curve for a point that is Z standard deviations to the right of the mean.

The table below shows the total area under the
The table below shows the total area under the normal curve for a point that is Z standard deviations to the right of the mean. 0.5 0.6 0.7 0.8 Z 0.00 0.01 0.02 0.03 0.04 0.05 0.06 0.07 0.08 0.09 0.0 0.5000 0.5040 0.5080 0.5120 0.5160 0.5199 0.5239 0.5279 0.5319 0.5359 0.1 0.5398 0.5438 0.5478 0.5517 0.5557 0.5596 0.5636 0.5675 0.5714 0.5754 0.2 0.5793 0.5832 0.5871 0.5910 0.5948 0.5987 0.6026 0.6064 0.6103 0.6141 0.3 0.6179 0.6217 0.6255 0.6293 0.6331 0.6368 0.6406 0.6443 0.6480 0.6517 0.4 0.6554 0.6591 0.6628 0.6664 0.6700 0.6736 0.6772 0.6808 0.6844 0.6879 0.6915 0.6950 0.6985 0.7019 0.7054 0.7088 0.7123 0.7157 0.7190 0.7224 0.7258 0.7291 0.7324 0.7357 0.7389 0.7422 0.7454 0.7486 0.7518 0.7549 0.7580 0.7612 0.7642 0.7673 0.7704 0.7734 0.7764 0.7794 0.7823 0.7852 0.7881 0.7910 0.7939 0.7967 0.7996 0.8023 0.8051 0.8079 0.8106 0.8133 0.8159 0.8186 0.8212 0.8238 0.8264 0.8289 0.8315 0.8340 0.8365 0.8389 0.8413 0.8438 0.8461 0.8485 0.8508 0.8531 0.8554 0.8577 0.8599 0.8621 0.8643 0.8665 0.8686 0.8708 0.8729 0.8749 0.8770 0.8790 0.8810 0.8830 0.8849 0.8869 0.8888 0.8907 0.8925 0.8944 0.8962 0.8980 0.8997 0.9015 0.9032 0.9049 0.9066 0.9082 0.9099 0.9115 0.9131 0.9147 0.9162 0.9177 0.9192 0.9207 0.9222 0.9236 0.9251 0.9265 0.9279 0.9292 0.9306 0.9319 0.9332 0.9345 0.9357 0.9370 0.9382 0.9394 0.9406 0.9418 0.9430 0.9441 0.9452 0.9463 0.9474 0.9485 0.9495 0.9505 0.9515 0.9525 0.9535 0.9545 0.9554 0.9564 0.9573 0.9582 0.9591 0.9599 0.9608 0.9616 0.9625 0.9633 1.8 0.9641 0.9649 0.9656 0.9664 0.9671 0.9678 0.9686 0.969 0.9700 0.9706 0.9 1.0 1.1 1.2 1.3 1.4 1.5 1.6 1.7 In a P system, the lead time for a box of weed-killer is two weeks and the review period is one week. Demand during the protection interval averages 255 boxes, with a standard deviation of demand during the protection interval of 40 boxes. a. What is the cycle-service level when the target inventory is set at 300 boxes? Refer to the landard normal lab? as needed. The cycle-service level is%. (Enter your response rounded to two decimal places) A golf specialty wholesaler operates 50 weeks per year, Management is trying to determine an inventory policy for its 1-irons, which have the following characteristics: > Demand (D)- 2,500 units/year >Demand is normally distributed > Standard deviation of weekly demand 2 units > Ordering cost = $30/order > Annual holding cost (H) = $6.00/unit > Desired cycle-service level = 92% > Lead time (L) 3 weeks Refer to the standard normal table for z-values. a. If the company uses a periodic review system, P should be weeks. (Enter your response rounded to the nearest whole number.) The Bucks Grande exhibition baseball team plays 50 weeks each year and uses an average of 320 baseballs per week. The team orders baseballs from Coopers-Town Inc., a ball manufacturer noted for six-sigma level consistency and high product quality. The cost to order baseballs is $100 per order and the annual holding cost per ball is 38% of the purchase price. Coopers-Town's price structure is shown in the table below. A Order Quantity Price per Unit $7.56 1-999 1,000-4,999 5,000 or more $7.10 $6.75 a. How many baseballs should the team buy per order? The team should buy baseballs per order. (Enter your response rounded to the nearest whole number)

Step by Step Solution

There are 3 Steps involved in it

1 Expert Approved Answer
Step: 1 Unlock blur-text-image
Question Has Been Solved by an Expert!

Get step-by-step solutions from verified subject matter experts

Step: 2 Unlock
Step: 3 Unlock

Students Have Also Explored These Related General Management Questions!