

Question: The table below shows values of f(x) at selected values of x. The function g(x) is shown in the graph below. y=h(f(2)) y =
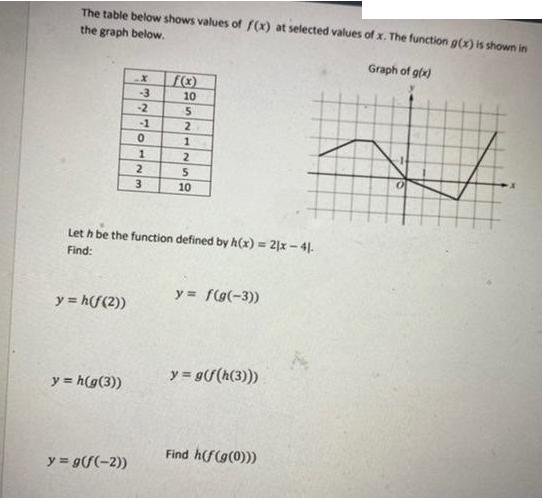
The table below shows values of f(x) at selected values of x. The function g(x) is shown in the graph below. y=h(f(2)) y = h(g(3)) x -3 -2 y = g(f(-2)) -1 0 1 2 3 f(x) 10 5 2 1 2 Let h be the function defined by h(x) = 2x - 41. Find: 5 10 y = f(g(-3)) y = g(f(h(3))) Graph of g(x) 2 Find h(f(g(0)))
Step by Step Solution
★★★★★
3.40 Rating (156 Votes )
There are 3 Steps involved in it
1 Expert Approved Answer
Step: 1 Unlock

f310 f25 f12 f01 f12 f25 f310 g32 g22 g11 g00 g31 g53 hx... View full answer
Question Has Been Solved by an Expert!
Get step-by-step solutions from verified subject matter experts
Step: 2 Unlock
Step: 3 Unlock