

Question: The table below (which is an embedded Excel worksheet) shows planned work and progress on a control account having five work packages. For each work
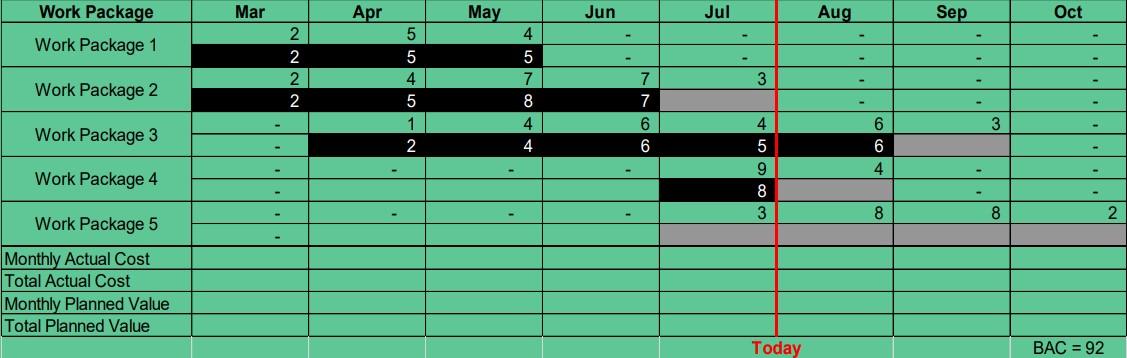
The table below (which is an embedded Excel worksheet) shows planned work and progress on a control account having five work packages. For each work package and period, the top number (in black) shows planned value for that period, and the bottom number (in white) shows actual cost. Planned durations are shown in gray; completed work in black. Today's date at the end of July is shown in red.
Draw a chart showing planned value (BCWS), earned value (BCWP), actual cost (ACWP), and earned schedule (ES) as a function of time (showing all values in each month). For today's date, what are the schedule variance, cost variance, schedule performance index, cost performance index, critical index, and the schedule performance index in time (SPI(t))?
Step by Step Solution
There are 3 Steps involved in it

Get step-by-step solutions from verified subject matter experts