

Question: The table compares the average daily temperature and ice cream sales each day. Temperature (F) Ice Cream Sales 56.1 $107 60.3 $116 64.2 $120 66.4
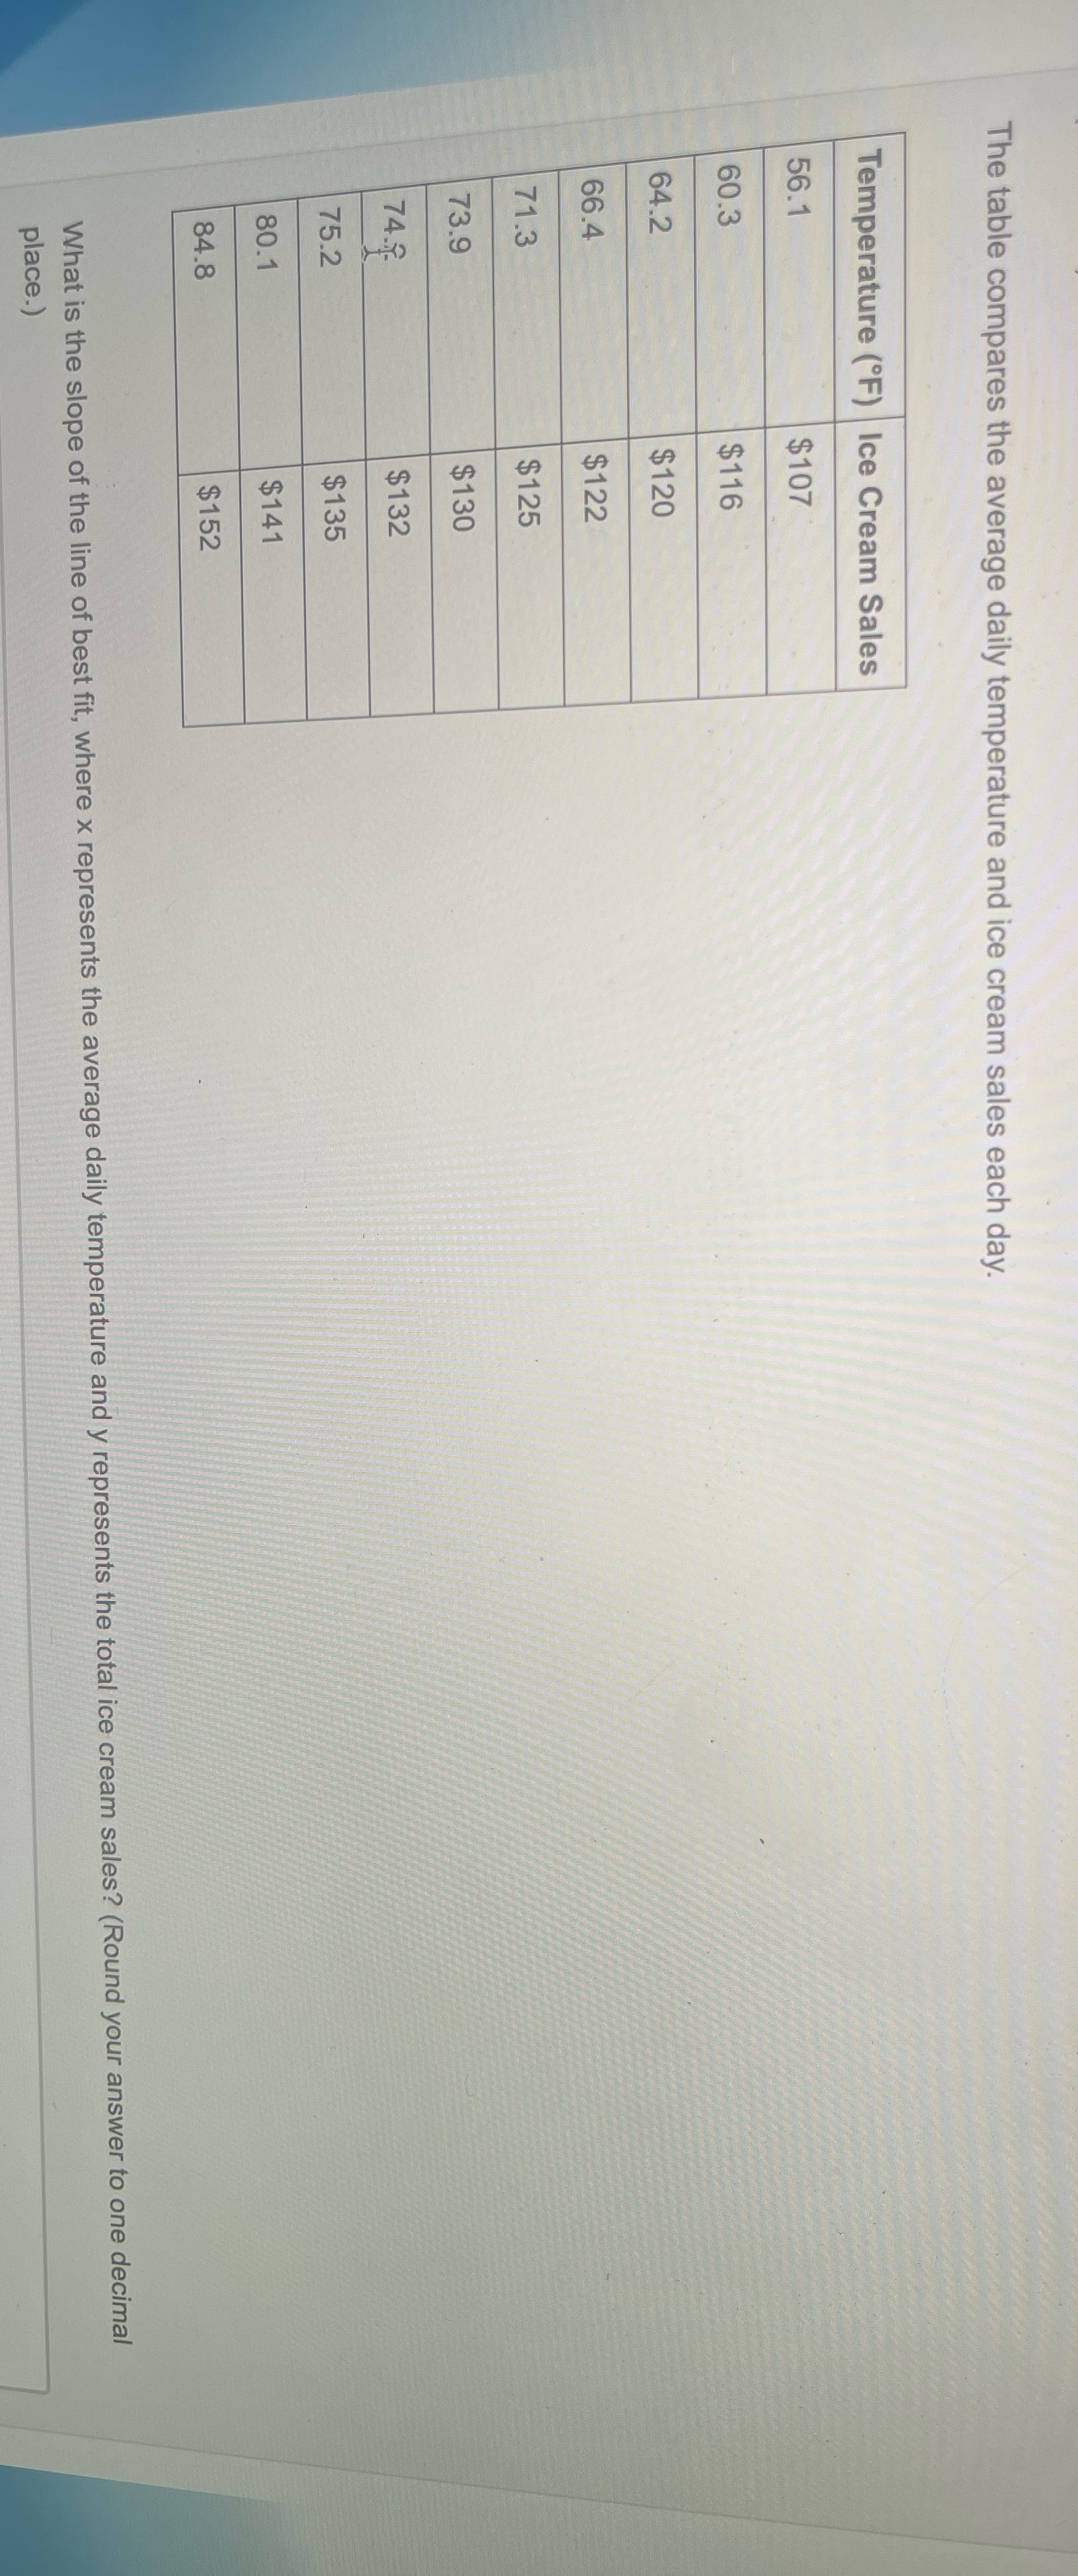
The table compares the average daily temperature and ice cream sales each day. Temperature (F) Ice Cream Sales 56.1 $107 60.3 $116 64.2 $120 66.4 $122 71.3 $125 73.9 $130 74.5- $132 75.2 $135 80.1 $141 84.8 $152 What is the slope of the line of best fit, where x represents the average daily temperature and y represents the total ice cream sales? (Round your answer to one decimal place.)
Step by Step Solution
There are 3 Steps involved in it
1 Expert Approved Answer
Step: 1 Unlock

Question Has Been Solved by an Expert!
Get step-by-step solutions from verified subject matter experts
Step: 2 Unlock
Step: 3 Unlock