

Question: The table shows 20 samples for the piston ring process, taken after the initial control charts were established. Plot these data on the I? and
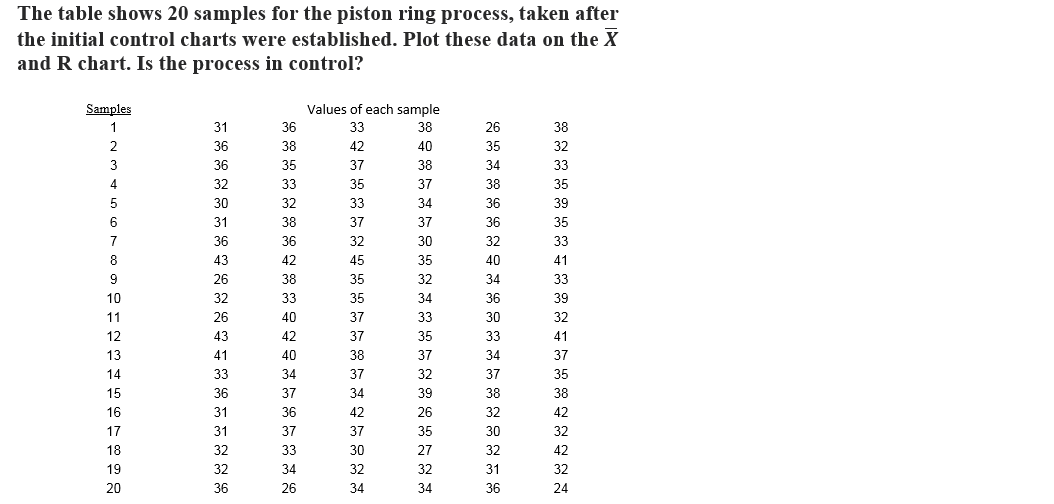
The table shows 20 samples for the piston ring process, taken after the initial control charts were established. Plot these data on the I? and R chart. Is the process in control? Samgles Values of each sample 1 31 36 33 38 26 38 2 36 38 42 4t] 35 32 3 36 35 3? 38 34 33 4 32 33 35 3? 38 35 5 38 32 33 34 36 39 6 31 38 3? 3? 36 35 ? 36 36 32 3{] 32 33 8 43 42 45 35 4{] 41 9 26 38 35 32 34 33 1D 32 33 35 34 36 39 1 1 26 4D 3? 33 3i] 32 12 43 42 3? 35 33 41 13 41 4D 38 3? 34 3? 14 33 34 3? 32 3? 35 15 36 3? 34 39 38 38 1B 31 36 42 26 32 42 1? 31 3? 3? 35 3{] 32 18 32 33 38 2? 32 42 19' 32 34 32 32 31 32 2D 36 26 34 34 36 24
Step by Step Solution
There are 3 Steps involved in it
1 Expert Approved Answer
Step: 1 Unlock

Question Has Been Solved by an Expert!
Get step-by-step solutions from verified subject matter experts
Step: 2 Unlock
Step: 3 Unlock