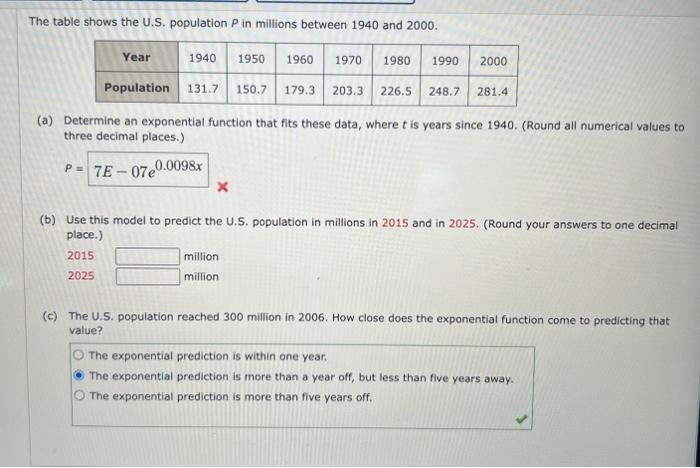
Question: The table shows the U.S. population P in millions between 1940 and 2000. (a) Determine an exponential function that fits these data, where t is

The table shows the U.S. population P in millions
The table shows the U.S. population P in millions between 1940 and 2000. (a) Determine an exponential function that fits these data, where t is years since 1940. (Round all numerical values to three decimal places.) P= (b) Use this model to predict the U.S. population in millions in 2015 and in 2025. (Round your answers to one decimal place.) 20152025millionmillion (c) The U.S. population reached 300 million in 2006. How close does the exponential function come to predicting that value? The exponential prediction is within one year. The exponential prediction is more than a year off, but less than five years away. The exponential prediction is more than five years off

Step by Step Solution

There are 3 Steps involved in it

1 Expert Approved Answer
Step: 1 Unlock blur-text-image
Question Has Been Solved by an Expert!

Get step-by-step solutions from verified subject matter experts

Step: 2 Unlock
Step: 3 Unlock

Students Have Also Explored These Related General Management Questions!