

Question: The tables below show the hydrograph values for a region with five different zones. The first table gives the area enclosed within each zone, assume
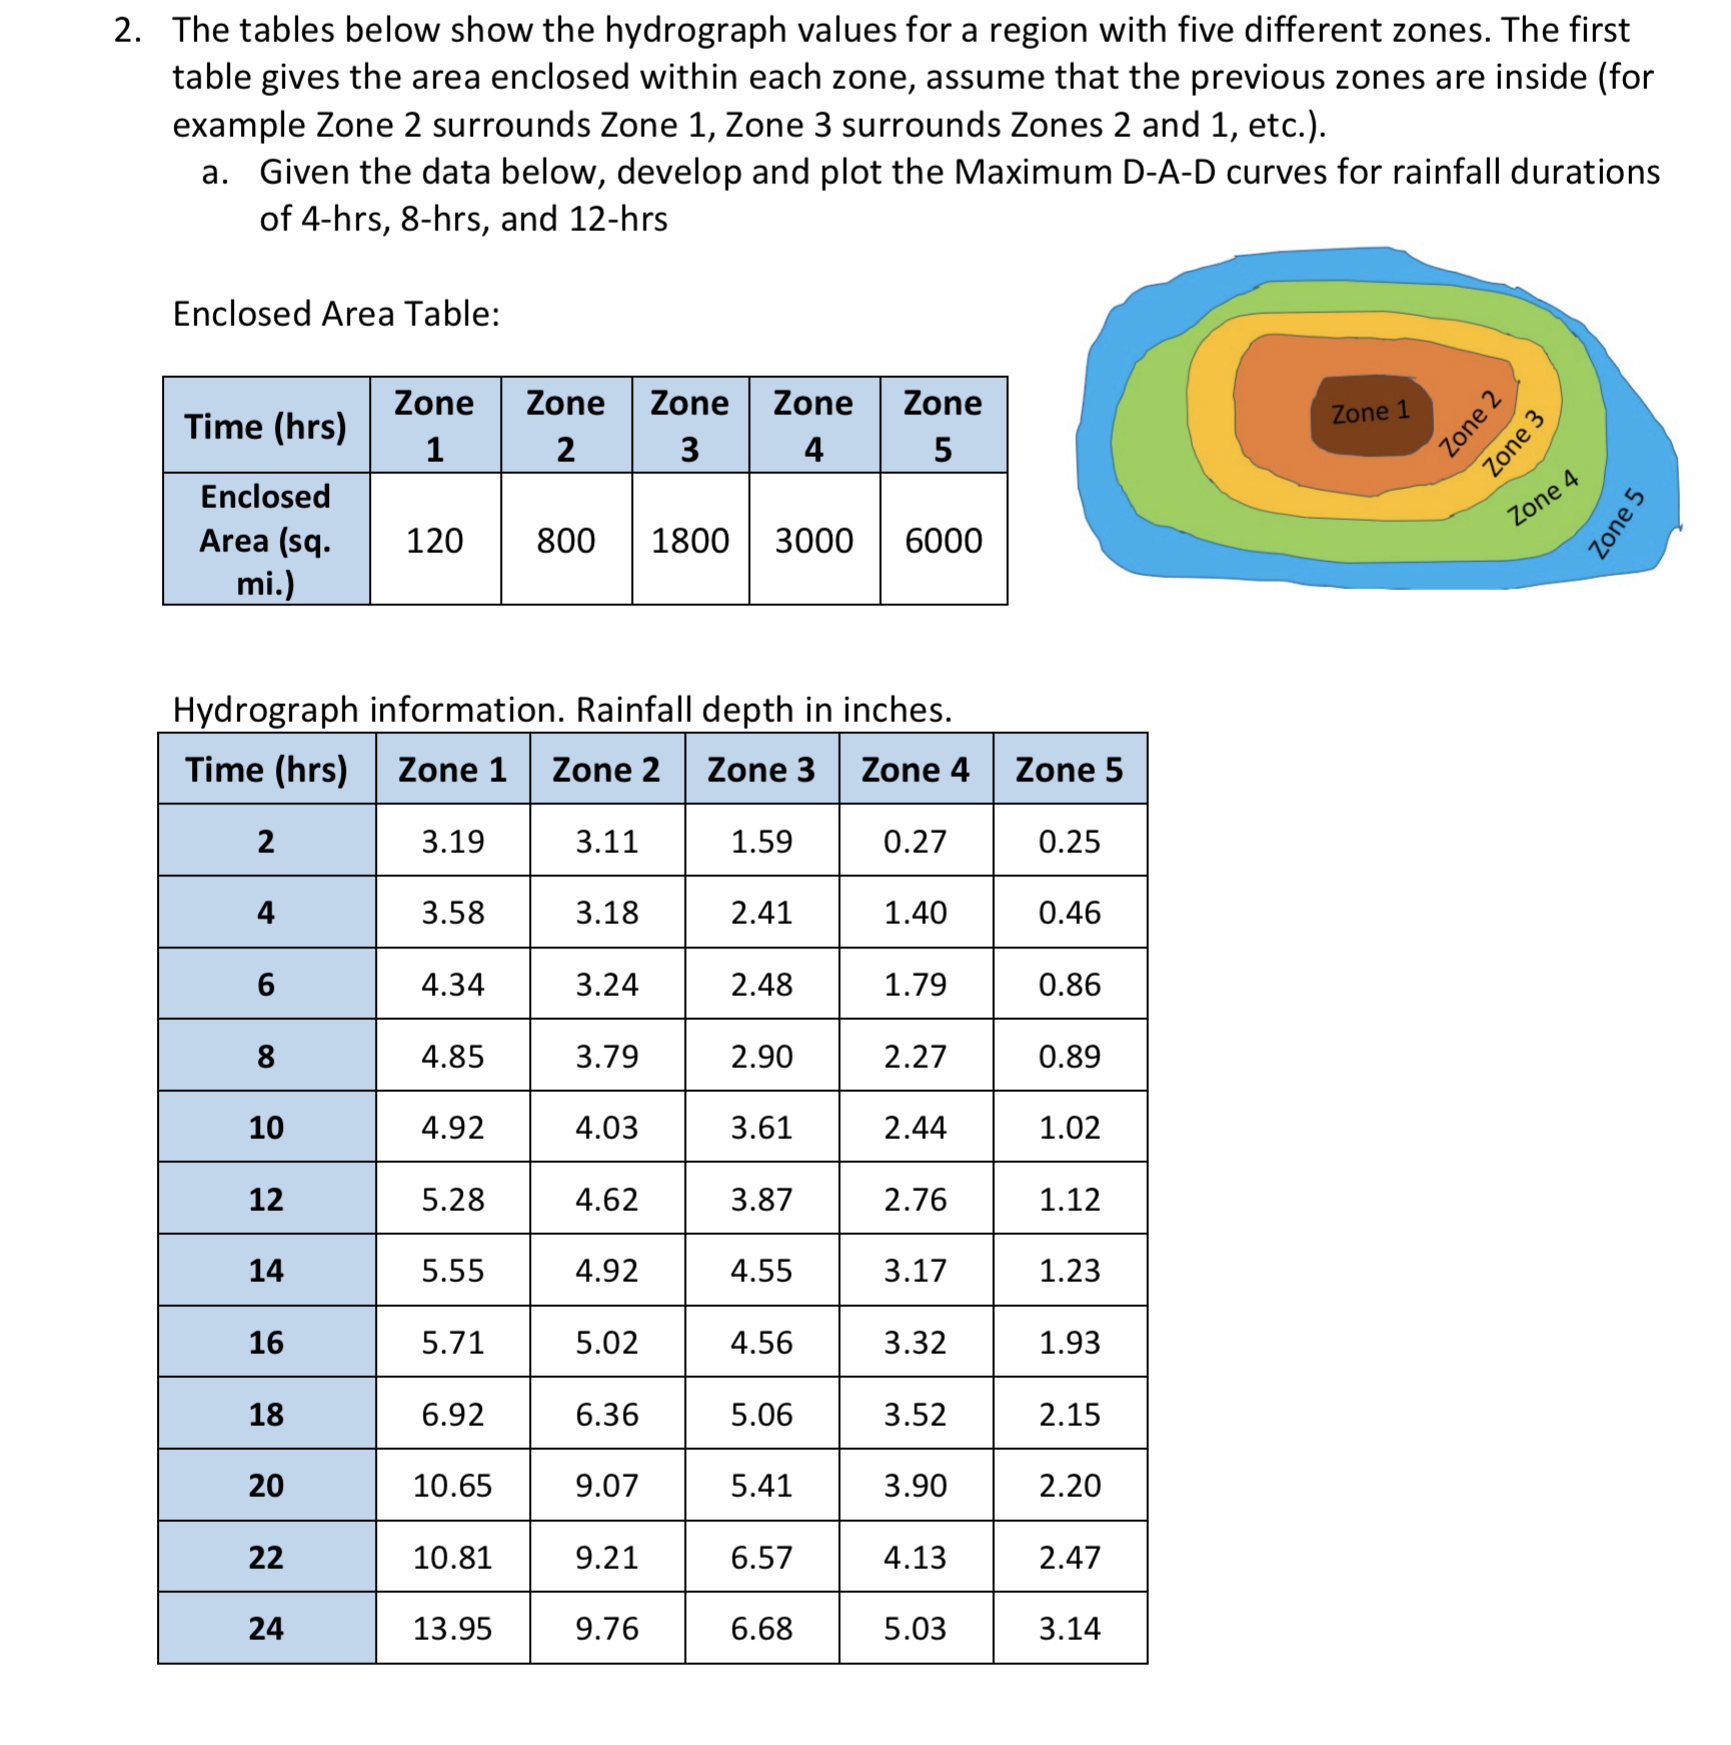
The tables below show the hydrograph values for a region with five different zones. The first table gives the area enclosed within each zone, assume that the previous zones are inside for example Zone surrounds Zone Zone surrounds Zones and etc.
a Given the data below, develop and plot the Maximum DAD curves for rainfall durations of hrshrs and hrs
Enclosed Area Table:
tableTime hrstableZone
Step by Step Solution
There are 3 Steps involved in it
1 Expert Approved Answer
Step: 1 Unlock

Question Has Been Solved by an Expert!
Get step-by-step solutions from verified subject matter experts
Step: 2 Unlock
Step: 3 Unlock