

Question: The tables below show the hydrograph values for a region with three different zones. The first table gives the area enclosed within each zone. The
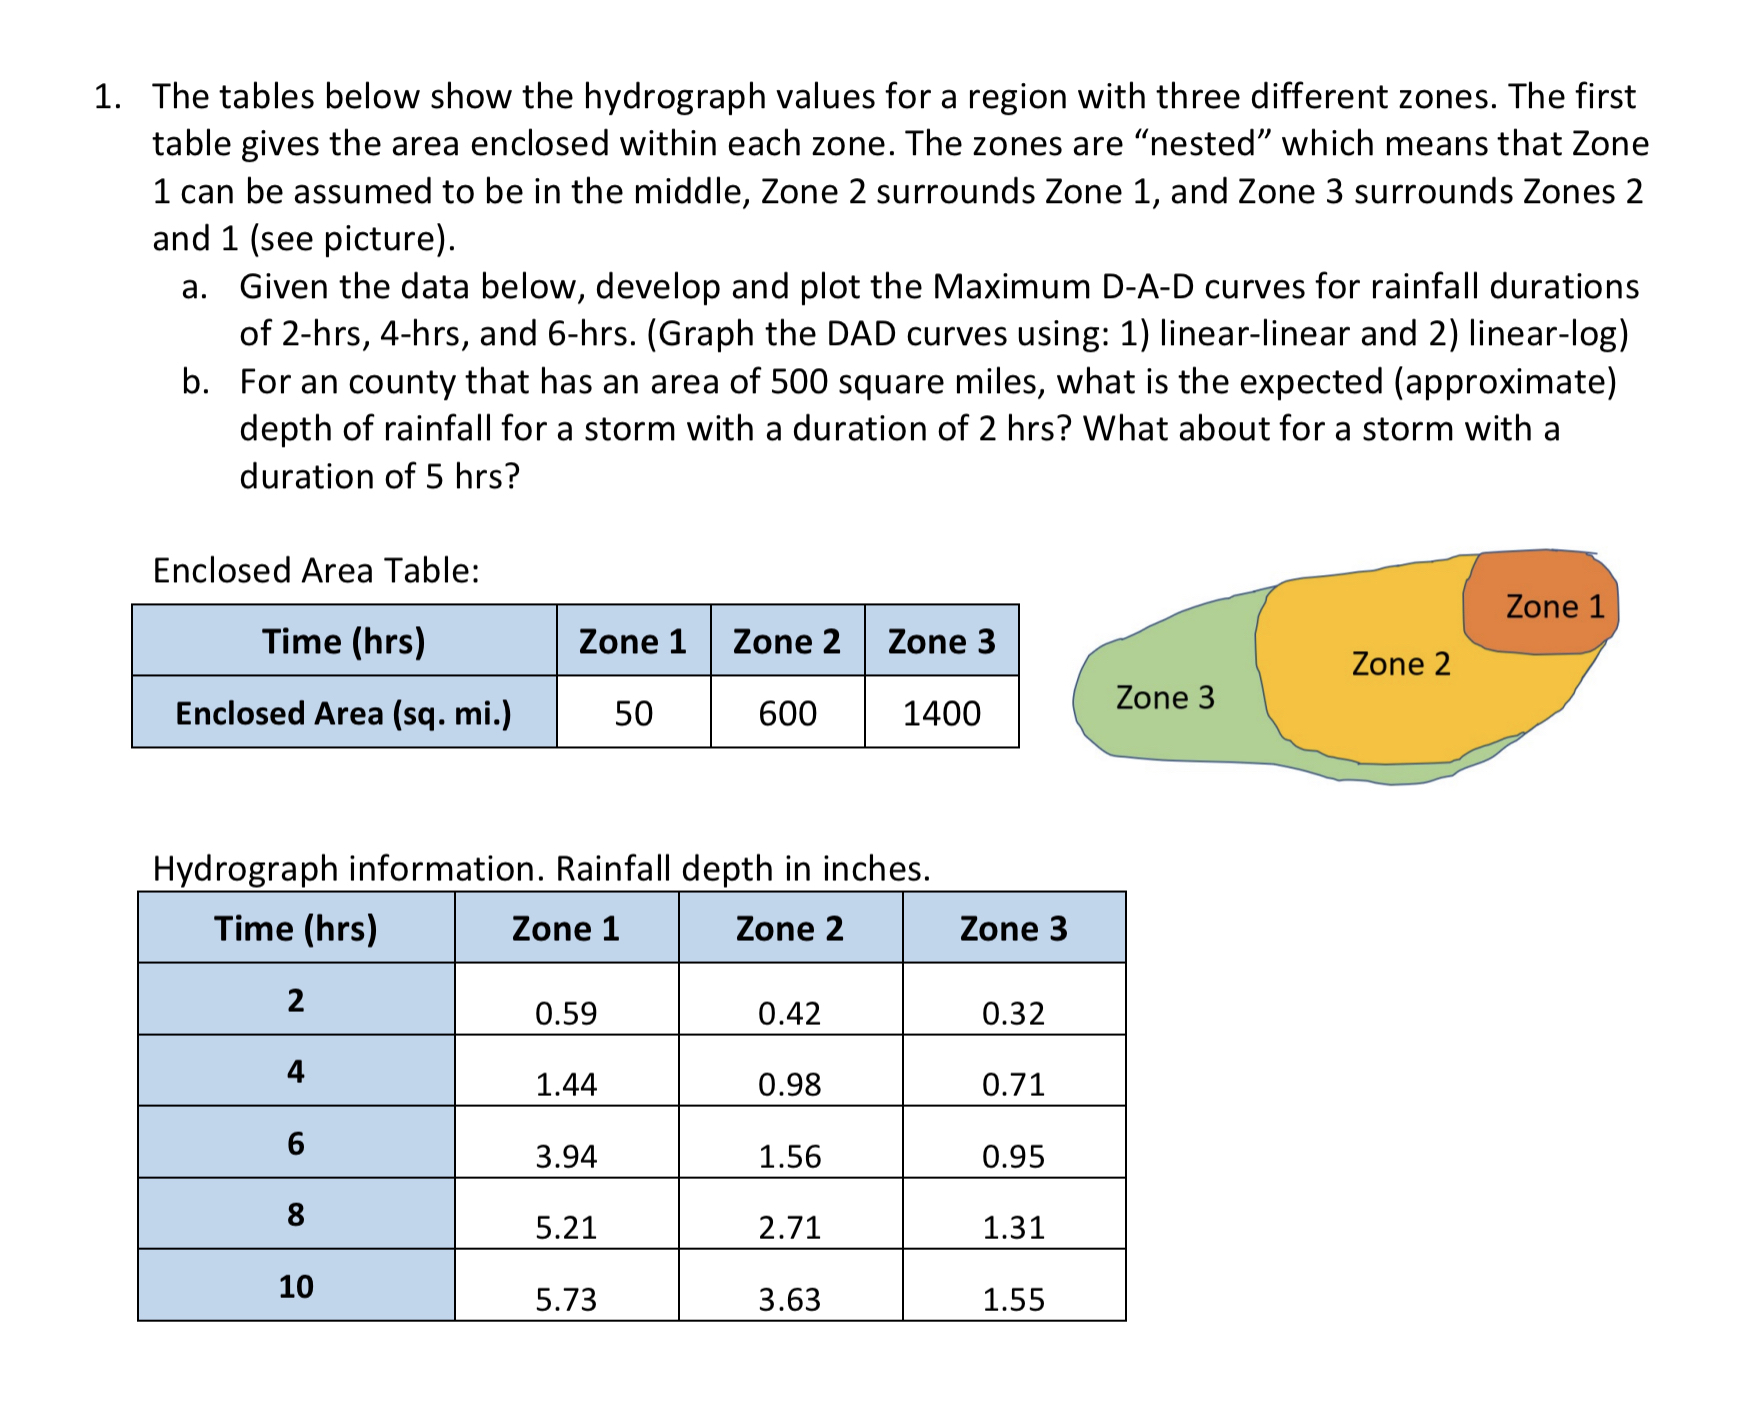
The tables below show the hydrograph values for a region with three different zones. The first table gives the area enclosed within each zone. The zones are "nested" which means that Zone can be assumed to be in the middle, Zone surrounds Zone and Zone surrounds Zones and see picture
a Given the data below, develop and plot the Maximum DAD curves for rainfall durations of hrshrs and hrsGraph the DAD curves using: linearlinear and linearlog
b For an county that has an area of square miles, what is the expected approximate depth of rainfall for a storm with a duration of What about for a storm with a duration of
Enclosed Area Table:
tableTime hrsZone Zone Zone Enclosed Area sq mi
Hydrograph information. Rainfall depth in inches.
tableTime hrsZone Zone Zone
Step by Step Solution
There are 3 Steps involved in it
1 Expert Approved Answer
Step: 1 Unlock

Question Has Been Solved by an Expert!
Get step-by-step solutions from verified subject matter experts
Step: 2 Unlock
Step: 3 Unlock