

Question: The time, in seconds, it takes a random sample of 27 chickens to cross the road is displayed in the histogram. It was determined that
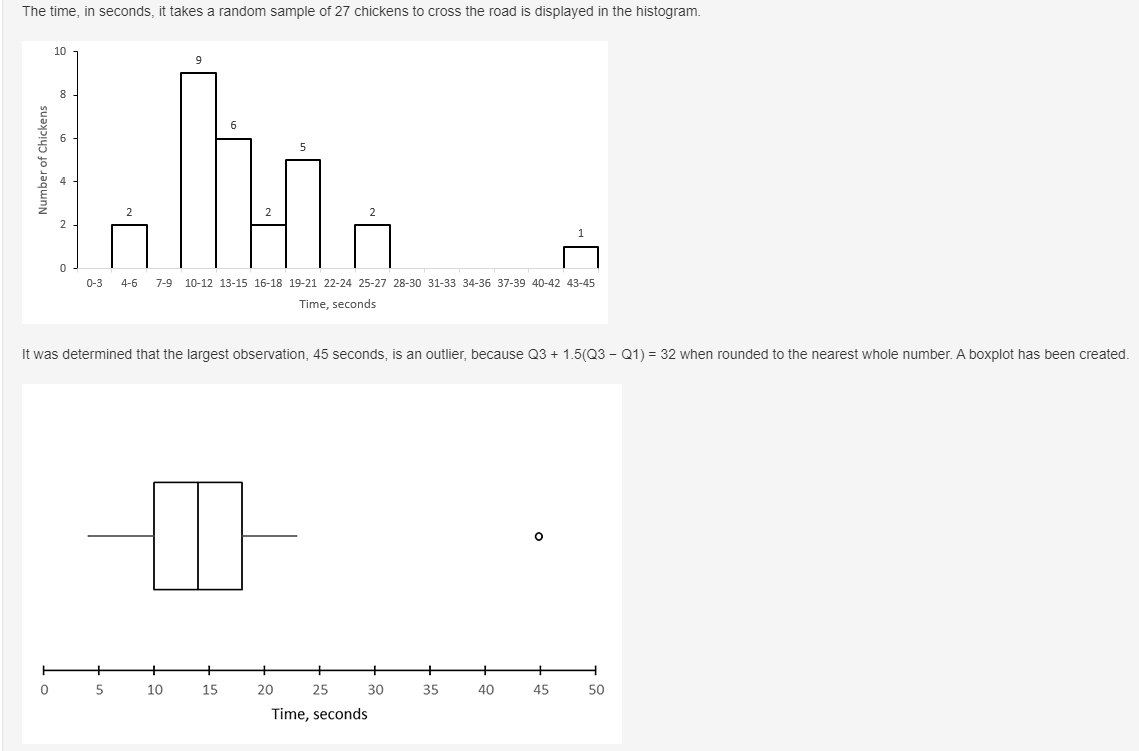
The time, in seconds, it takes a random sample of 27 chickens to cross the road is displayed in the histogram.
It was determined that the largest observation, 45 seconds, is an outlier, because Q3 + 1.5(Q3 ? Q1) = 32 when rounded to the nearest whole number. A boxplot has been created.
Does the boxplot represent the information given in the histogram?
A. Yes
B. No, the boxplot should be skewed right
C. No, the boxplot should be skewed left
D. No, the left whisker should extend to zero
E. No, the right whisker should extend to 45
The time, in seconds, it takes a random sample of 27 chickens to cross the road is displayed in the histogram. 10 9 6 5 Number of Chickens 2 2 2 0-3 4-6 7-9 10-12 13-15 16-18 19-21 22-24 25-27 28-30 31-33 34-36 37-39 40-42 43-45 Time, seconds It was determined that the largest observation, 45 seconds, is an outlier, because Q3 + 1.5(Q3 - Q1) = 32 when rounded to the nearest whole number. A boxplot has been created O o 45 50 5 10 15 20 25 30 35 40 Time, seconds
Step by Step Solution
There are 3 Steps involved in it

Get step-by-step solutions from verified subject matter experts