

Question: The trend line = 500 + 30t, (t = 1, 2, 3, , 20), and the seasonal indexes shown in the table below were computed
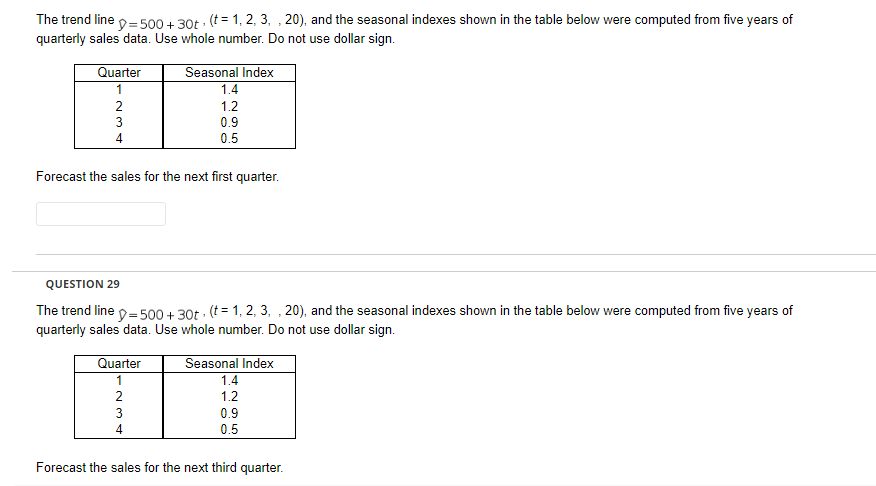
The trend line = 500 + 30t, (t = 1, 2, 3, , 20), and the seasonal indexes shown in the table below were computed from five years of quarterly sales data. Use whole number. Do not use dollar sign. Quarter Seasonal Index 1.4 1.2 0.9 0.5 Forecast the sales for the next first quarter. QUESTION 29 The trend line =500 + 30t , (t= 1, 2, 3, , 20), and the seasonal indexes shown in the table below were computed from five years of quarterly sales data. Use whole number. Do not use dollar sign. Quarter Seasonal Index 1.4 IN 1.2 0.9 0.5 Forecast the sales for the next third quarter
Step by Step Solution
There are 3 Steps involved in it
1 Expert Approved Answer
Step: 1 Unlock

Question Has Been Solved by an Expert!
Get step-by-step solutions from verified subject matter experts
Step: 2 Unlock
Step: 3 Unlock