

Question: The two graphs attached show the relationship between the number of items sold per week vs number of weeks since the item arrived at the
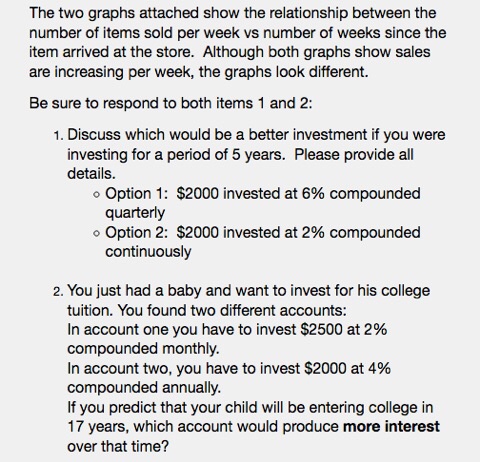
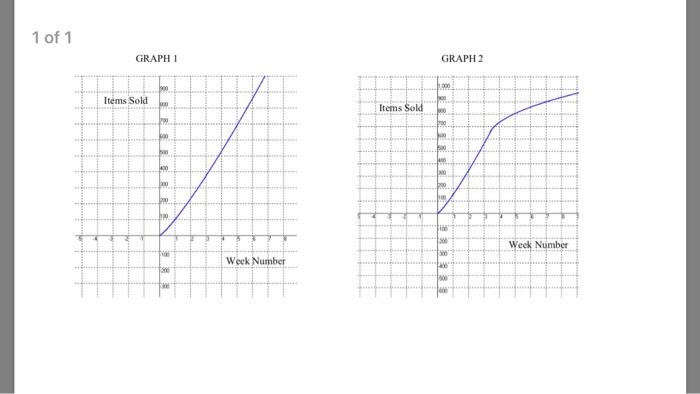
The two graphs attached show the relationship between the number of items sold per week vs number of weeks since the item arrived at the store. Although both graphs show sales are increasing per week, the graphs look different. Be sure to respond to both items 1 and 2: 1. Discuss which would be a better investment if you were investing for a period of 5 years. Please provide all details. o Option 1: $2000 invested at 6% compounded quarterly o Option 2: $2000 invested at 2% compounded continuously 2. You just had a baby and want to invest for his college tuition. You found two different accounts: In account one you have to invest $2500 at 2% compounded monthly. in account two, you have to invest $2000 at 4% compounded annually. If you predict that your child will be entering college in 17 years, which account would produce more interest over that time
Step by Step Solution
There are 3 Steps involved in it

Get step-by-step solutions from verified subject matter experts