

Question: The two graphs attached show the relationship between the number of items sold per week vs number of weeks since the item arrived at the
The two graphs attached show the relationship between the number of items sold per week vs number of weeks since the item arrived at the store. Although both graphs show sales are increasing per week, the graphs look different.
Discuss the following in terms of concepts in this chapter.
If you were the store manager, which item would you order more of during week 9 and why?
Reminder: Please make sure to comply with all Netiquette Guidelines listed in the Getting Started module.
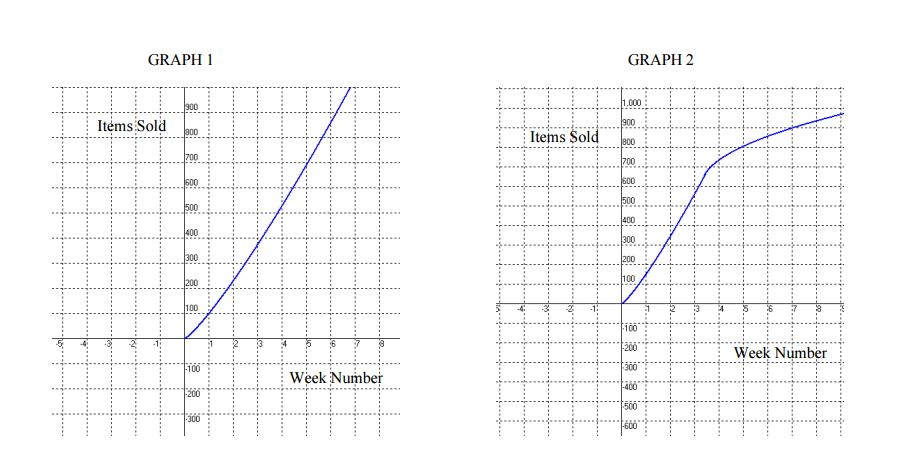
GRAPHI Items Sold Week Number Items sold GRAPH 2 400 Week Number
Step by Step Solution
There are 3 Steps involved in it
1 Expert Approved Answer
Step: 1 Unlock

Question Has Been Solved by an Expert!
Get step-by-step solutions from verified subject matter experts
Step: 2 Unlock
Step: 3 Unlock