

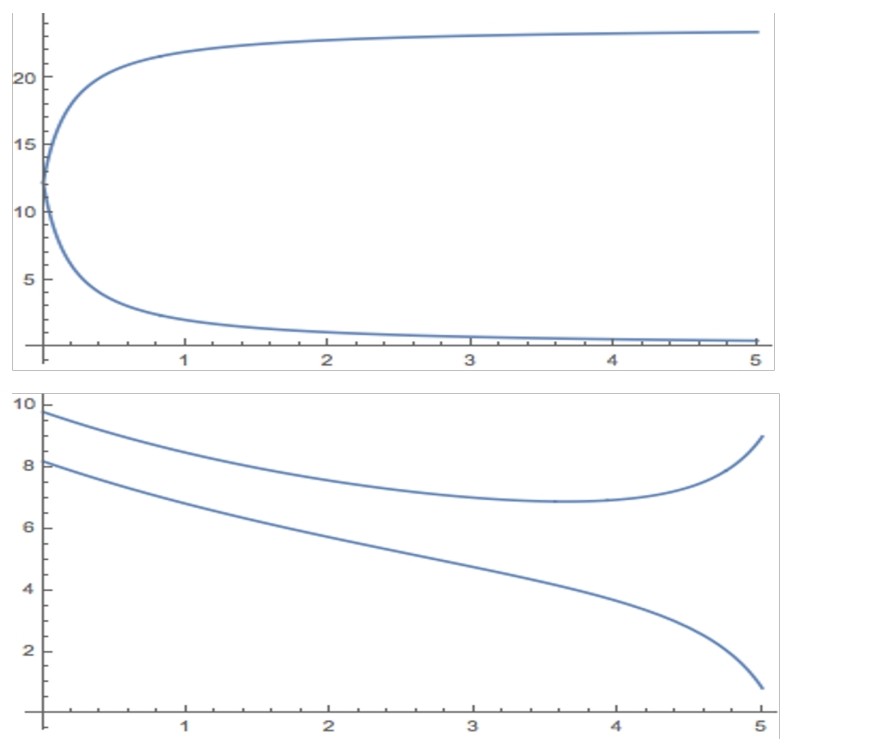
Question: The vertical axis on both plots is USD. The demand for product 1 is given by a 1 b 1 p 1 bp 2 and
The vertical axis on both plots is USD. The demand for product is given by abpbp and the
demand for product is given by a bp bp just as discussed in class. Note that the price elasticity
in a market with demand of the form p increases as increases a proof is included in the
end of this homework, for sake of completeness
The first plot is obtained for a a b b b x where x is represented in
the horizontal axis. The second plot is obtained for a a b b b z where zis
represented in the horizontal axis
For the first plot explain:
a which curve represents px and which curve represents px
b why do these curves intersect at x
c why do these curves diverge from each other as x increases
For the second plot explain
which curve represents pz and which curve represents pz
e why one curve is above the other at z
f why the difference between these curves increases as z increase
Step by Step Solution
There are 3 Steps involved in it
1 Expert Approved Answer
Step: 1 Unlock

Question Has Been Solved by an Expert!
Get step-by-step solutions from verified subject matter experts
Step: 2 Unlock
Step: 3 Unlock