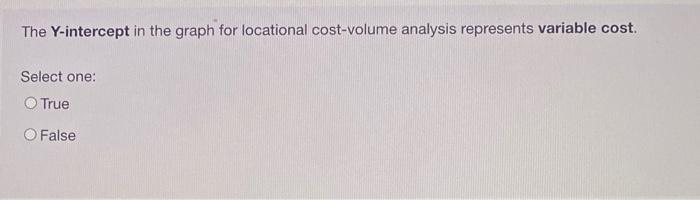
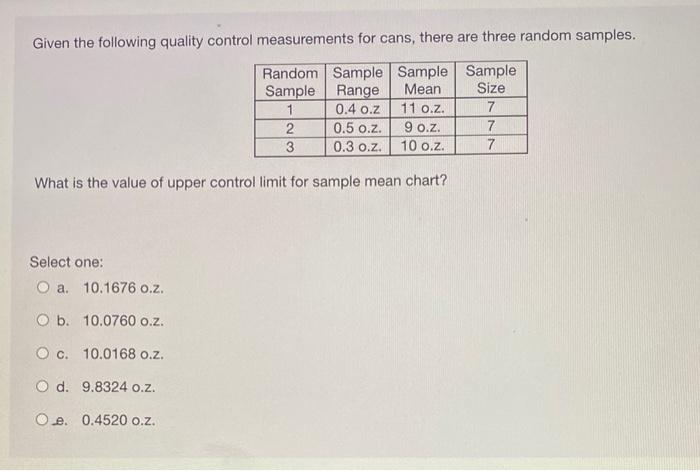
Question: The Y-intercept in the graph for locational cost-volume analysis represents variable cost. Select one: True False Given the following quality control measurements for cans, there

The Y-intercept in the graph for locational
The Y-intercept in the graph for locational cost-volume analysis represents variable cost. Select one: True False Given the following quality control measurements for cans, there are three random samples. What is the value of upper control limit for sample mean chart? Select one: a. 10.1676 o.z. b. 10.07600.2. c. 10.01680.2. d. 9.8324 o.z. . 0.4520 o.z

Step by Step Solution

There are 3 Steps involved in it

1 Expert Approved Answer
Step: 1 Unlock blur-text-image
Question Has Been Solved by an Expert!

Get step-by-step solutions from verified subject matter experts

Step: 2 Unlock
Step: 3 Unlock

Students Have Also Explored These Related General Management Questions!