

Question: There are 3 different question The following table reports some of the regression results for Grotesque General and General Fund. Regression Coefficient Probability of t-
There are 3 different question
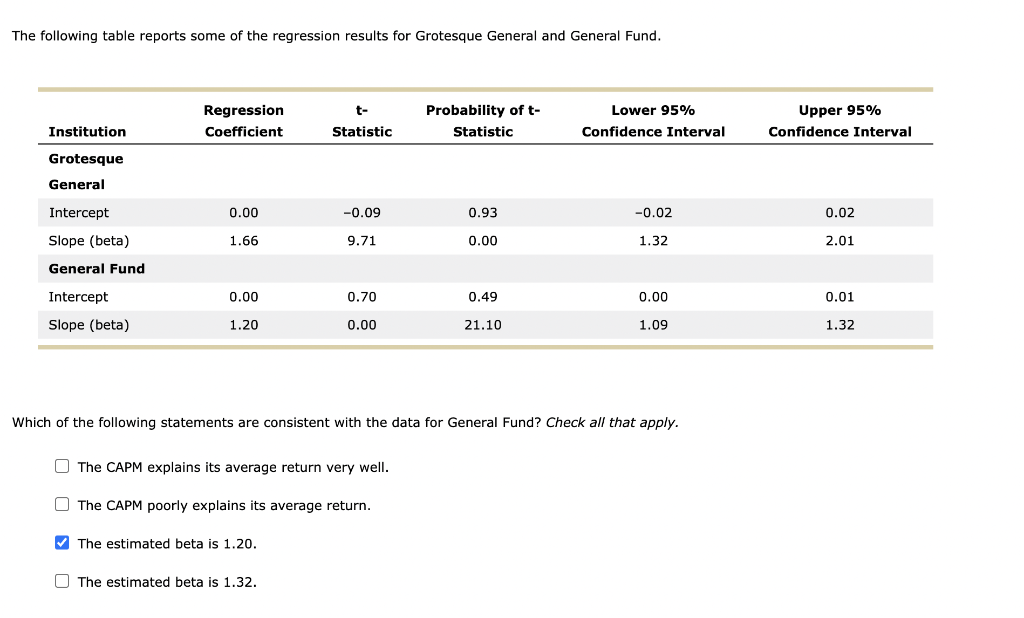
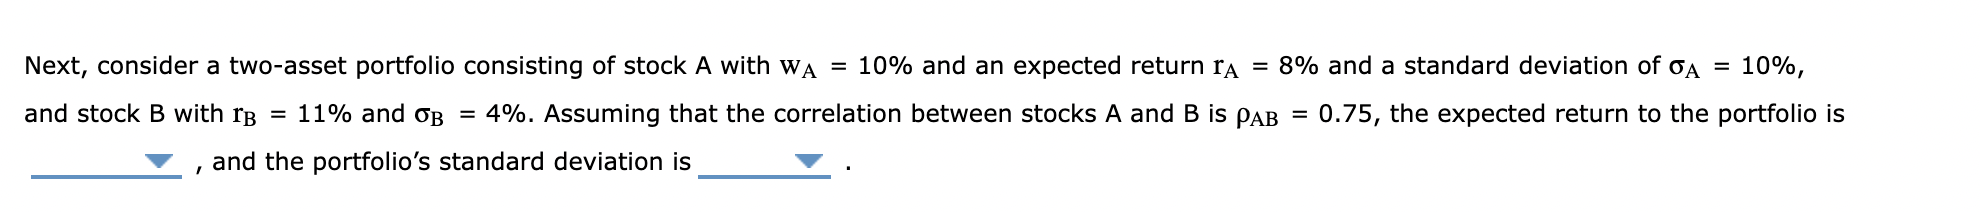
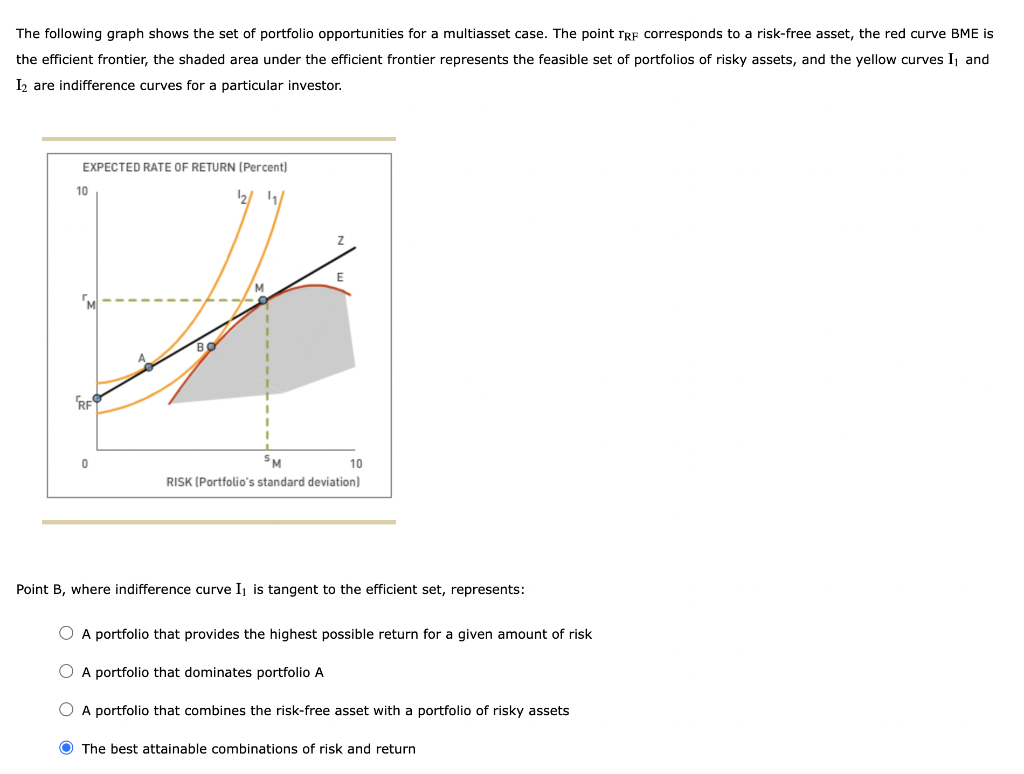
The following table reports some of the regression results for Grotesque General and General Fund. Regression Coefficient Probability of t- Statistic Lower 95% Confidence Interval Upper 95% Confidence Interval Institution Statistic Grotesque General Intercept 0.00 -0.09 0.93 -0.02 0.02 Slope (beta) 1.66 9.71 0.00 1.32 2.01 General Fund Intercept 0.00 0.70 0.49 0.00 0.01 Slope (beta) 1.20 0.00 21.10 1.09 1.32 Which of the following statements are consistent with the data for General Fund? Check all that apply. The CAPM explains its average return very well. The CAPM poorly explains its average return. The estimated beta is 1.20. O The estimated beta is 1.32. Next, consider a two-asset portfolio consisting of stock A with wa = 10% and an expected return ra = 8% and a standard deviation of a = 10%, and stock B with rb = 11% and OB = 4%. Assuming that the correlation between stocks A and B is PAB = 0.75, the expected return to the portfolio is and the portfolio's standard deviation is I The following graph shows the set of portfolio opportunities for a multiasset case. The point TRF corresponds to a risk-free asset, the red curve BME is the efficient frontier, the shaded area under the efficient frontier represents the feasible set of portfolios of risky assets, and the yellow curves I and 12 are indifference curves for a particular investor. EXPECTED RATE OF RETURN (Percent) 10 12/11/ M RF 0 SM 10 RISK (Portfolio's standard deviation) Point B, where indifference curve Iz is tangent to the efficient set, represents: O A portfolio that provides the highest possible return for a given amount of risk A portfolio that dominates portfolio A O A portfolio that combines the risk-free asset with a portfolio of risky assets The best attainable combinations of risk and return The following table reports some of the regression results for Grotesque General and General Fund. Regression Coefficient Probability of t- Statistic Lower 95% Confidence Interval Upper 95% Confidence Interval Institution Statistic Grotesque General Intercept 0.00 -0.09 0.93 -0.02 0.02 Slope (beta) 1.66 9.71 0.00 1.32 2.01 General Fund Intercept 0.00 0.70 0.49 0.00 0.01 Slope (beta) 1.20 0.00 21.10 1.09 1.32 Which of the following statements are consistent with the data for General Fund? Check all that apply. The CAPM explains its average return very well. The CAPM poorly explains its average return. The estimated beta is 1.20. O The estimated beta is 1.32. Next, consider a two-asset portfolio consisting of stock A with wa = 10% and an expected return ra = 8% and a standard deviation of a = 10%, and stock B with rb = 11% and OB = 4%. Assuming that the correlation between stocks A and B is PAB = 0.75, the expected return to the portfolio is and the portfolio's standard deviation is I The following graph shows the set of portfolio opportunities for a multiasset case. The point TRF corresponds to a risk-free asset, the red curve BME is the efficient frontier, the shaded area under the efficient frontier represents the feasible set of portfolios of risky assets, and the yellow curves I and 12 are indifference curves for a particular investor. EXPECTED RATE OF RETURN (Percent) 10 12/11/ M RF 0 SM 10 RISK (Portfolio's standard deviation) Point B, where indifference curve Iz is tangent to the efficient set, represents: O A portfolio that provides the highest possible return for a given amount of risk A portfolio that dominates portfolio A O A portfolio that combines the risk-free asset with a portfolio of risky assets The best attainable combinations of risk and return
Step by Step Solution
There are 3 Steps involved in it

Get step-by-step solutions from verified subject matter experts