

Question: There is extra information on this problem like the table that goes with it their standardized test scores are different from the ones you published
There is extra information on this problem like the table that goes with it their standardized test scores are different from the ones you published on this site the table was wrong
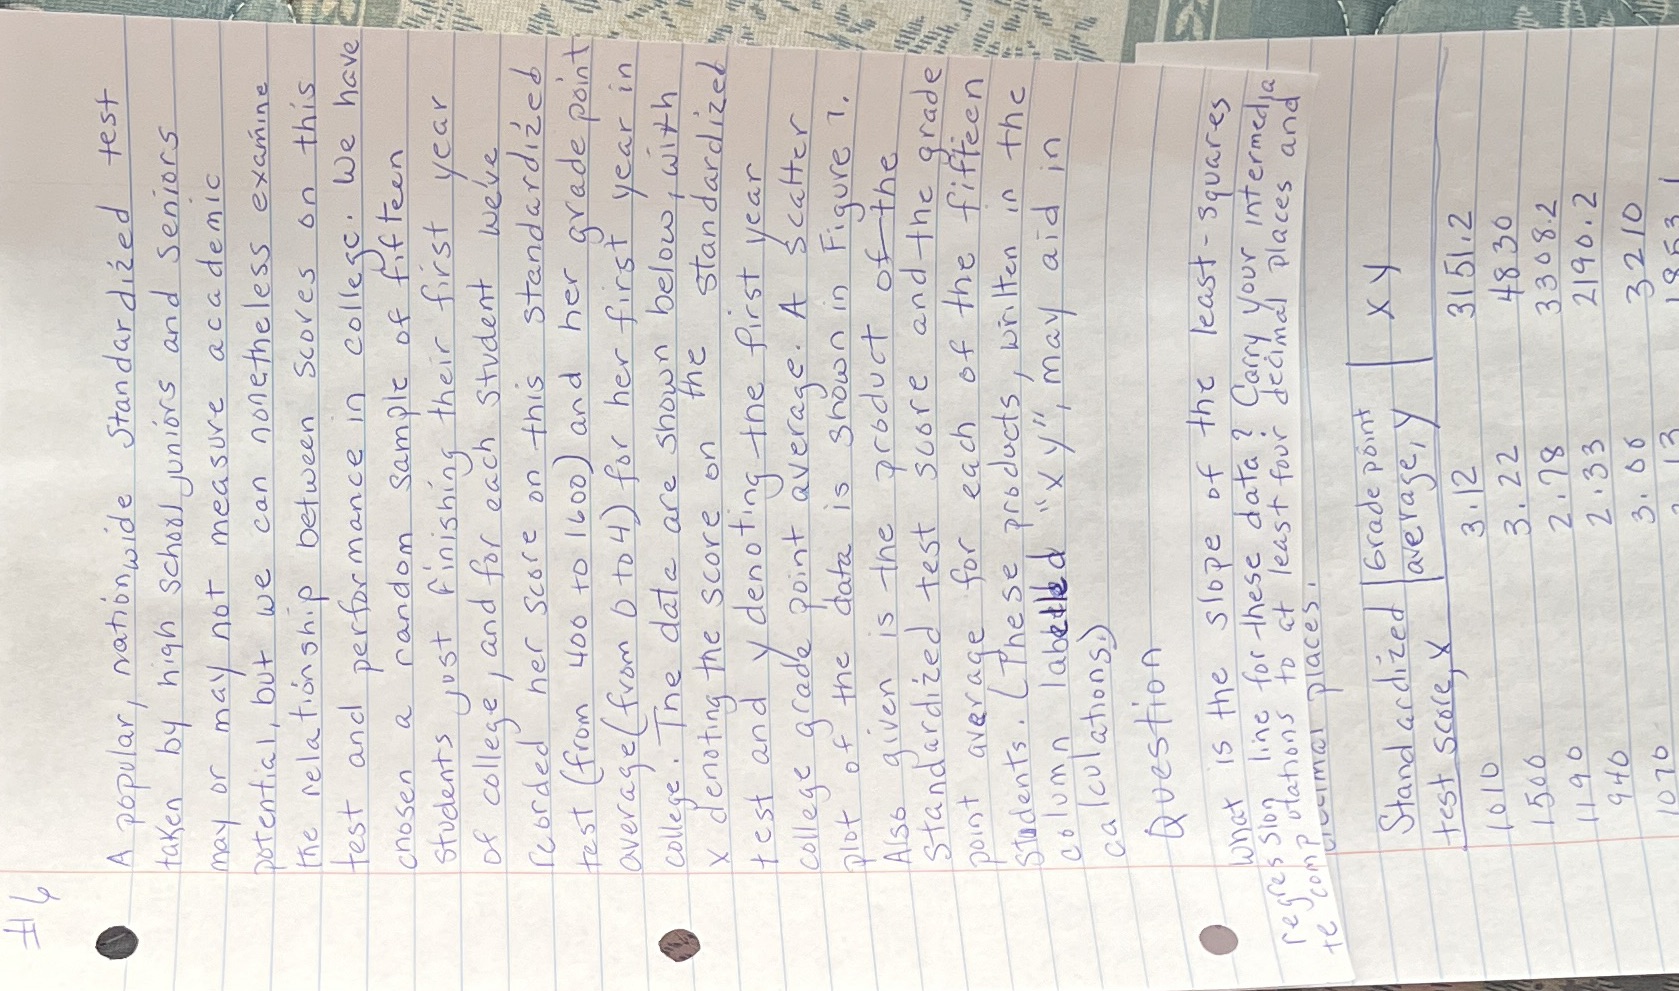
A popular, Nationwide Standardized test taken by high school juniors and seniors may or may not measure academic potential, but we can nonetheless examine the relationship between scores on this test and performance in college . We have chosen a random sample of fifteen students just finishing their first year of college , and for each student we've forded her score on this standardized test ( from 400 to 1600 ) and her grade point average ( from 0 to 4 ) for her first year in college. The data are shown below , with x denoting the score on the standardized test and y denoting the first year college grade point average . A scatter plot of the data is shown in Figure 7 . Also given is the product of the standardized test score and the grade point average for each of the fifteen students. ( These products, written in the column labeled " xy" may aid in calculations ! ) Question What Is the slope of the least - squares regression, line for these data ? Carry your intermedia te compilations to at least four decimal places and gurovimal places , Standardized Grade point test score X average, y 10 10 3. 12 31 51 1 2 1500 3. 22 48 30 3308.2 1190 2. 78 2.33 2190 . 2 940 3. 06 1076 3210
Step by Step Solution
There are 3 Steps involved in it

Get step-by-step solutions from verified subject matter experts